Analysis of the resonant components in $\overline{B}^0_s \to J/\psi\pi^+\pi^-$
[to restricted-access page]Information
LHCb-PAPER-2012-005
CERN-PH-EP-2012-111
arXiv:1204.5643 [PDF]
(Submitted on 25 Apr 2012)
Phys. Rev. D86 (2012) 052006
Inspire 1112264
Tools
Abstract
The decay Bs->J/\psi\pi+\pi- can be exploited to study CP violation. A detailed understanding of its structure is imperative in order to optimize its usefulness. An analysis of this three-body final state is performed using a 1.0/fb sample of data produced in 7 TeV pp collisions at the LHC and collected by the LHCb experiment. A modified Dalitz plot analysis of the final state is performed using both the invariant mass spectra and the decay angular distributions. The \pi+\pi- system is shown to be dominantly in an S-wave state, and the CP-odd fraction in this Bs decay is shown to be greater than 0.977 at 95 confidence level. In addition, we report the first measurement of the J/\psi\pi+\pi- branching fraction relative to J/\psi\phi of (19.79 +/- 0.47 +/- 0.52).
Figures and captions
|
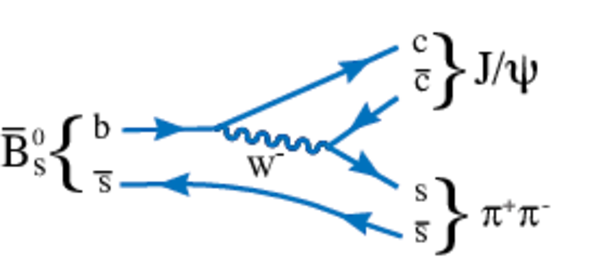
Leading order diagram for $\overline{ B }{} ^0_ s $ decays into $J/\psi \pi^+\pi^-$. |
feyn1.pdf [87 KiB] HiDef png [95 KiB] Thumbnail [110 KiB] *.C file |
|
|
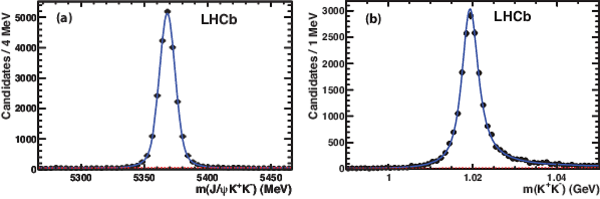
(a) Invariant mass spectrum of $J/\psi K^+K^-$ for candidates with $m(K^+K^-)<1050$ MeV. The data has been fitted with a double-Gaussian signal and linear background functions shown as a dashed line. The solid curve shows the sum. (b) Background subtracted invariant mass spectrum of $K^+K^-$ for events with $m(K^+K^-)<1050$ MeV. The dashed line (barely visible along the $x$-axis) shows the S-wave contribution and the solid curve is the sum of the S-wave and a P-wave Breit-Wigner functions, fitted to the data. |
JpsiKK.pdf [39 KiB] HiDef png [221 KiB] Thumbnail [136 KiB] *.C file |
|
|
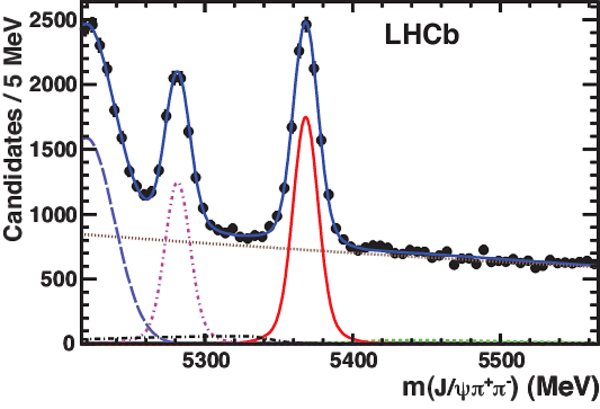
Invariant mass of $J/\psi \pi^+\pi^-$ candidate combinations. The data have been fitted with double-Gaussian signal and several background functions. The (red) solid line shows the $\overline{ B }{} ^0_ s $ signal, the (brown) dotted line shows the combinatorial background, the (green) short-dashed shows the $B^-$ background, the (purple) dot-dashed is $\overline{ B }{} ^0 \rightarrow J/\psi \pi^+\pi^-$, the (black) dot-long dashed is the sum of $\overline{ B }{} ^0_ s \rightarrow J/\psi\eta'$ and $\overline{ B }{} ^0_ s \rightarrow J/\psi\phi$ when $\phi\rightarrow \pi^+\pi^-\pi^0$ backgrounds, the (light blue) long-dashed is the $\overline{ B }{} ^0 \rightarrow J/\psi K^- \pi^+$ reflection, and the (blue) solid line is the total. |
fitmass.pdf [41 KiB] HiDef png [466 KiB] Thumbnail [268 KiB] *.C file |
|
|
Background subtracted $\chi$ distribution from $\overline{ B }{} ^0_ s \rightarrow J/\psi \pi^+\pi^-$ candidates. |
bkgsubchi.pdf [77 KiB] HiDef png [175 KiB] Thumbnail [148 KiB] *.C file |

|
|
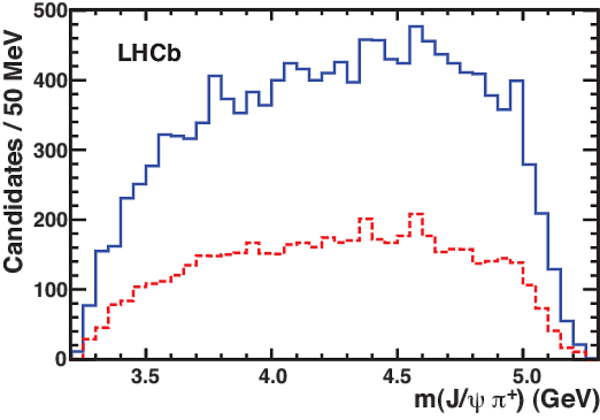
Distribution of $m(J/\psi \pi^+)$ for $\overline{ B }{} ^0_ s \rightarrow J/\psi \pi^+\pi^-$ candidate decays within $\pm20$ MeV of $\overline{ B }{} ^0_ s $ mass shown with the (blue) solid line; $m(J/\psi \pi^+)$ for wrong-sign $J/\psi \pi^+\pi^+$ combinations is shown with the (red) dashed line, as an estimate of the background. |
m-jpsipi.pdf [35 KiB] HiDef png [162 KiB] Thumbnail [170 KiB] *.C file |
|
|
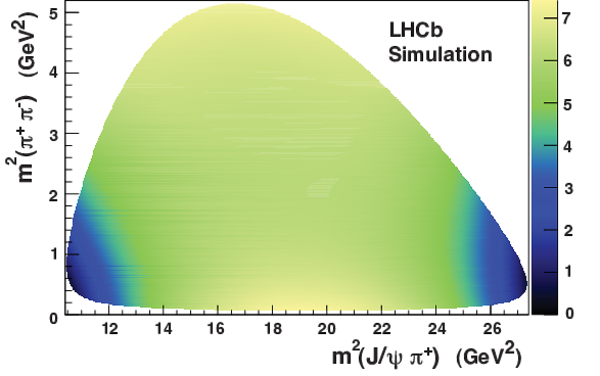
Distribution of $s_{23}\equiv m^2(\pi^+\pi^-)$ versus $s_{12}\equiv m^2(J/\psi\pi^+)$ for $\overline{ B }{} ^0_ s $ candidate decays within $\pm20$ MeV of $\overline{ B }{} ^0_ s $ mass. |
dalitz-1.pdf [129 KiB] HiDef png [1 MiB] Thumbnail [706 KiB] *.C file |

|
|
Parametrized detection efficiency as a function of $s_{23}\equiv m^2(\pi^+\pi^-)$ versus $s_{12}\equiv m^2(J/\psi\pi^+)$. The scale is arbitrary. |
effmod[..].pdf [582 KiB] HiDef png [1 MiB] Thumbnail [457 KiB] *.C file |
|
|
Projections of invariant mass squared of (a) $s_{12}\equiv m^2(J/\psi \pi^+)$ and (b) $s_{23}\equiv m^2(\pi^+\pi^-)$ of the MC Dalitz plot used to measure the efficiency parameters. The points represent the MC generated event distributions and the curves the polynomial fit. |
eff.pdf [38 KiB] HiDef png [265 KiB] Thumbnail [146 KiB] *.C file |

|
|
Distributions of (a) $\cos\theta_{J/\psi}$, (b) $\cos\theta_{KK}$ for $J/\psi\phi$ background subtracted data (points) compared with the MC simulation (histogram). |
cos_theta.pdf [31 KiB] HiDef png [182 KiB] Thumbnail [121 KiB] *.C file |

|
|
Projections of invariant mass squared of (a) $s_{12}\equiv m^2(J/\psi \pi^+)$ and (b) $s_{23}\equiv m^2(\pi^{\pm}\pi^{\pm})$ of the background Dalitz plot. |
xy_bkgnew.pdf [40 KiB] HiDef png [218 KiB] Thumbnail [144 KiB] *.C file |

|
|
The $\cos\theta_{J/\psi}$ distribution of the background and the fitted function $1+\alpha\cos\theta_{J/\psi}+\beta \cos^{2}\theta_{J/\psi}$. |
bkg_cosH.pdf [37 KiB] HiDef png [254 KiB] Thumbnail [209 KiB] *.C file |

|
|
Dalitz fit projections of $m^2(\pi^+ \pi^-)$ fit with 3R+NR for the preferred model. The points with error bars are data, the signal fit is shown with a (red) dashed line, the background with a (black) dotted line, and the (blue) solid line represents the total. The normalized residuals in each bin are shown below, defined as the difference between the data and the fit divided by the error on the data. |
mpipi-[..].pdf [82 KiB] HiDef png [311 KiB] Thumbnail [245 KiB] *.C file |

|
|
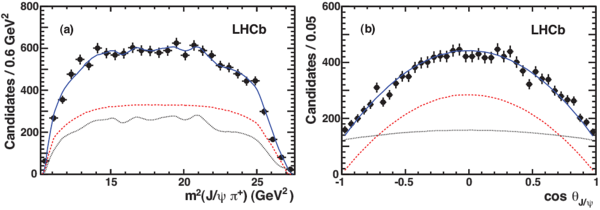
Dalitz fit projections of (a) $s_{12}\equiv m^2(J/\psi \pi^{+})$ and (b) $\cos \theta_{J/\psi}$ fit with the 3R+NR preferred model. The points with error bars are data, the signal fit is shown with a (red) dashed line, the background with a (black) dotted line, and the (blue) solid line represents the total. |
8R1-R3.pdf [37 KiB] HiDef png [274 KiB] Thumbnail [158 KiB] *.C file |
|
|
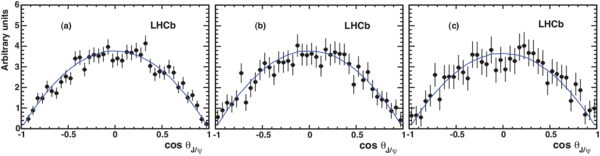
Background subtracted and acceptance corrected $\cos \theta_{J/\psi}$ helicity distributions fit with the preferred model: (a) in $f_0(980)$ mass region defined within $\pm90$ MeV of 980 MeV ($\chi^2$/ndf =39/40), (b) in $f_2(1270)$ mass region defined within one full width of $f_2(1270)$ mass ($\chi^2$/ndf =25/40), (c) in $f_0(1370)$ mass region defined within one full width of $f_2(1370)$ mass ($\chi^2$/ndf = 24/40). The points with error bars are data and the solid blue lines show the fit from the 3R+NR model. |
2JPsi2_all.pdf [32 KiB] HiDef png [231 KiB] Thumbnail [129 KiB] *.C file |
|
|
Background subtracted and acceptance corrected $\cos \theta_{\pi\pi}$ helicity distributions fit the preferred model: (a) in $f_0(980)$ mass region defined within $\pm90$ MeV of 980 MeV ($\chi^2$/ndf =38/40), (b) in $f_2(1270)$ mass region defined within one full width of $f_2(1270)$ mass ($\chi^2$/ndf = 32/40), (c) in $f_0(1370)$ mass region defined within one full width of $f_2(1370)$ mass ($\chi^2$/ndf =37/40). The points with error bars are data and the solid blue lines show the fit from the 3R+NR model. |
2PP2_all.pdf [32 KiB] HiDef png [214 KiB] Thumbnail [120 KiB] *.C file |

|
|
Background subtracted and acceptance corrected $\cos \theta_{\pi\pi}$ helicity distributions fit the preferred model: (a) in $[-90,0]$ MeV of 980 MeV ($\chi^2$/ndf =41/40), (b) in $[0,90]$ MeV of 980 MeV ($\chi^2$/ndf =31/40) |
2sol2_all.pdf [33 KiB] HiDef png [220 KiB] Thumbnail [134 KiB] *.C file |

|
|
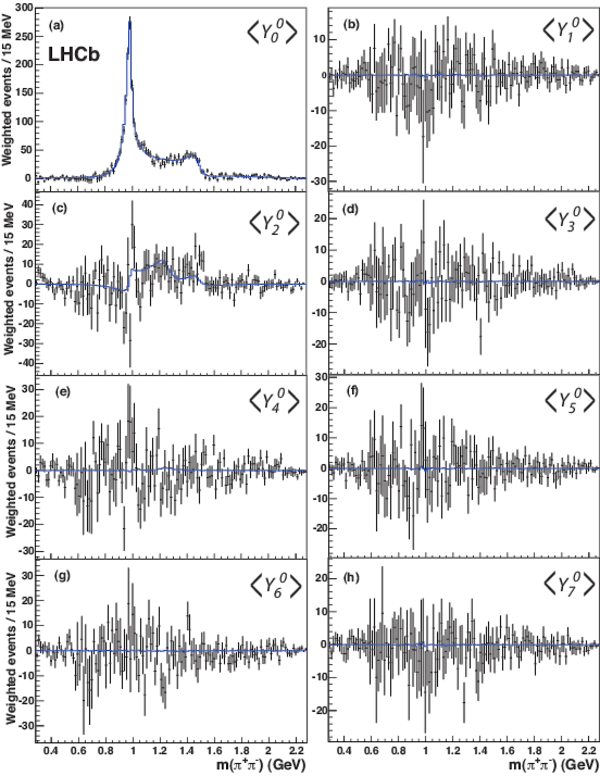
The $\pi^+\pi^-$ mass dependence of the spherical harmonic moments of $\cos \theta_{\pi\pi}$ after efficiency corrections and background subtraction: (a) $\langle Y^0_0\rangle$, (b) $\langle Y^0_1\rangle$, (c) $\langle Y^0_2\rangle$, (d) $\langle Y^0_3\rangle$, (e) $\langle Y^0_4\rangle$, (f) $\langle Y^0_5\rangle$, (g) $\langle Y^0_6\rangle$, and (h) $\langle Y^0_7\rangle$. The points with error bars are the data points and the solid curves are derived from the 3R+NR preferred model. |
2SPH.pdf [102 KiB] HiDef png [721 KiB] Thumbnail [615 KiB] *.C file |
|
|
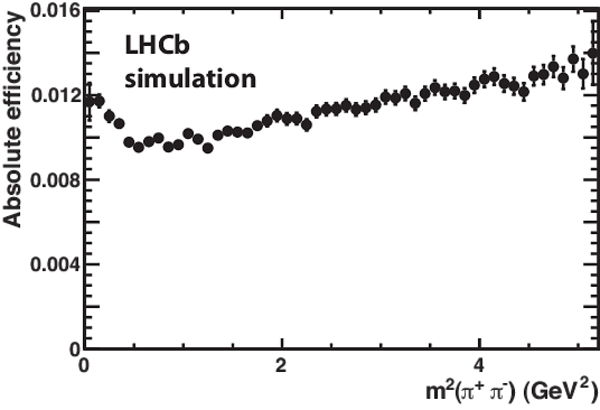
Detection efficiency of $\overline{ B }{} ^0_ s \rightarrow J/\psi\pi^+\pi^-$ as a function of $s_{23}\equiv m^{2}(\pi^+\pi^-)$. |
jpsipi[..].pdf [34 KiB] HiDef png [202 KiB] Thumbnail [172 KiB] *.C file |
|
|
Animated gif made out of all figures. |
PAPER-2012-005.gif Thumbnail |

|
![HiDef png [95 KiB]](Directory_LHCb-PAPER-2012-005/hidef_feyn1.png)
![HiDef png [221 KiB]](Directory_LHCb-PAPER-2012-005/hidef_JpsiKK.png)
![HiDef png [466 KiB]](Directory_LHCb-PAPER-2012-005/hidef_fitmass.png)
![HiDef png [175 KiB]](Directory_LHCb-PAPER-2012-005/hidef_bkgsubchi.png)
![HiDef png [162 KiB]](Directory_LHCb-PAPER-2012-005/hidef_m-jpsipi.png)
![HiDef png [1 MiB]](Directory_LHCb-PAPER-2012-005/hidef_dalitz-1.png)
![HiDef png [1 MiB]](Directory_LHCb-PAPER-2012-005/hidef_effmodel_patrick.png)
![HiDef png [265 KiB]](Directory_LHCb-PAPER-2012-005/hidef_eff.png)
![HiDef png [182 KiB]](Directory_LHCb-PAPER-2012-005/hidef_cos_theta.png)
![HiDef png [218 KiB]](Directory_LHCb-PAPER-2012-005/hidef_xy_bkgnew.png)
![HiDef png [254 KiB]](Directory_LHCb-PAPER-2012-005/hidef_bkg_cosH.png)
![HiDef png [311 KiB]](Directory_LHCb-PAPER-2012-005/hidef_mpipi-fits2-single.png)
![HiDef png [274 KiB]](Directory_LHCb-PAPER-2012-005/hidef_8R1-R3.png)
![HiDef png [231 KiB]](Directory_LHCb-PAPER-2012-005/hidef_2JPsi2_all.png)
![HiDef png [214 KiB]](Directory_LHCb-PAPER-2012-005/hidef_2PP2_all.png)
![HiDef png [220 KiB]](Directory_LHCb-PAPER-2012-005/hidef_2sol2_all.png)
![HiDef png [721 KiB]](Directory_LHCb-PAPER-2012-005/hidef_2SPH.png)
![HiDef png [202 KiB]](Directory_LHCb-PAPER-2012-005/hidef_jpsipipieff.png)
Tables and captions
|
Possible resonance candidates in the $\overline{ B }{} ^0_ s \rightarrow J/\psi \pi^+\pi^-$ decay mode. |
Table_1.pdf [38 KiB] HiDef png [86 KiB] Thumbnail [38 KiB] tex code |

|
|
Models used in data fit. |
Table_2.pdf [30 KiB] HiDef png [72 KiB] Thumbnail [34 KiB] tex code |

|
|
Breit-Wigner resonance parameters. |
Table_3.pdf [39 KiB] HiDef png [70 KiB] Thumbnail [35 KiB] tex code |

|
|
$\chi^2/\text{ndf}$ and $\rm -ln\mathcal{L}$ of different resonance models. |
Table_4.pdf [39 KiB] HiDef png [125 KiB] Thumbnail [58 KiB] tex code |

|
|
Fit fractions (%) of contributing components for the preferred model. For P- and D-waves $\lambda$ represents the final state helicity. Here $\rho$ refers to the $\rho(770)$ meson. |
Table_5.pdf [49 KiB] HiDef png [93 KiB] Thumbnail [45 KiB] tex code |

|
|
Fit fractions (%) of contributing components from different models for the alternate solution. For P- and D-waves $\lambda$ represents the final state helicity. Here $\rho$ refers to the $\rho(770)$ meson. |
Table_6.pdf [49 KiB] HiDef png [91 KiB] Thumbnail [44 KiB] tex code |

|
|
Fit fractions (%) of interference terms for both solutions of the 3R+NR model. |
Table_7.pdf [37 KiB] HiDef png [65 KiB] Thumbnail [32 KiB] tex code |

|
|
Fit results from the 3R+NR model for both the preferred and alternate solutions. $\phi$ indicates the phase with respect to the $f_0(980)$. For the $f_2(1270)$, $\lambda$ represents the final state helicity. |
Table_8.pdf [56 KiB] HiDef png [156 KiB] Thumbnail [73 KiB] tex code |

|
|
Normalized fit fractions (%) for alternate and preferred 3R+NR models and the ratio $R$ (%) relative to $\overline{ B }{} ^0_ s \rightarrow J/\psi\phi$. The numbers for the $f_2(1270)$ refer only to the $\lambda=0$ state. |
Table_9.pdf [53 KiB] HiDef png [53 KiB] Thumbnail [24 KiB] tex code |

|
|
Relative systematic uncertainties on $R$(%). |
Table_10.pdf [60 KiB] HiDef png [72 KiB] Thumbnail [32 KiB] tex code |

|
|
Changes due to modified acceptance function. |
Table_11.pdf [55 KiB] HiDef png [111 KiB] Thumbnail [53 KiB] tex code |

|
![HiDef png [86 KiB]](Directory_LHCb-PAPER-2012-005/hidef_Table_1.png)
![HiDef png [72 KiB]](Directory_LHCb-PAPER-2012-005/hidef_Table_2.png)
![HiDef png [70 KiB]](Directory_LHCb-PAPER-2012-005/hidef_Table_3.png)
![HiDef png [125 KiB]](Directory_LHCb-PAPER-2012-005/hidef_Table_4.png)
![HiDef png [93 KiB]](Directory_LHCb-PAPER-2012-005/hidef_Table_5.png)
![HiDef png [91 KiB]](Directory_LHCb-PAPER-2012-005/hidef_Table_6.png)
![HiDef png [65 KiB]](Directory_LHCb-PAPER-2012-005/hidef_Table_7.png)
![HiDef png [156 KiB]](Directory_LHCb-PAPER-2012-005/hidef_Table_8.png)
![HiDef png [53 KiB]](Directory_LHCb-PAPER-2012-005/hidef_Table_9.png)
![HiDef png [72 KiB]](Directory_LHCb-PAPER-2012-005/hidef_Table_10.png)
![HiDef png [111 KiB]](Directory_LHCb-PAPER-2012-005/hidef_Table_11.png)
Created on 27 April 2024.