Measurement of the CP-violating phase $\phi_s$ in $\overline{B}^0_s \to J/\psi\pi^+\pi^-$ decays
[to restricted-access page]Information
LHCb-PAPER-2012-006
CERN-PH-EP-2012-107
arXiv:1204.5675 [PDF]
(Submitted on 25 Apr 2012)
Phys. Lett. B713 (2012) 378
Inspire 1112268
Tools
Abstract
Measurement of the mixing-induced CP-violating phase phi_s in Bs decays is of prime importance in probing new physics. Here 7421 +/- 105 signal events from the dominantly CP-odd final state J/\psi pi+ pi- are selected in 1/fb of pp collision data collected at sqrt{s} = 7 TeV with the LHCb detector. A time-dependent fit to the data yields a value of phi_s=-0.019^{+0.173+0.004}_{-0.174-0.003} rad, consistent with the Standard Model expectation. No evidence of direct CP violation is found.
Figures and captions
|
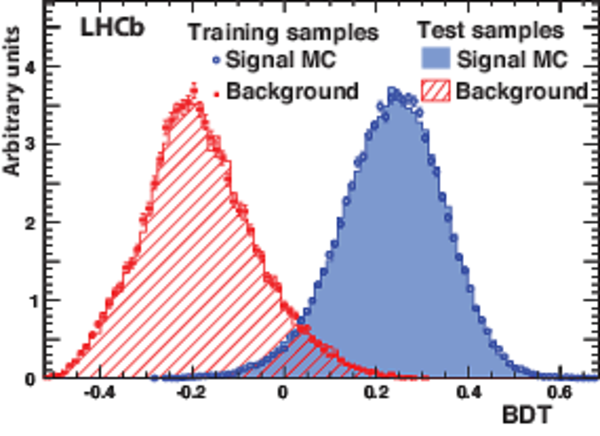
Distributions of the BDT variable for both training and test samples of $ { J \mskip -3mu/\mskip -2mu\psi \mskip 2mu} \pi\pi$ signal and background events. The signal samples are from simulation and the background samples derived from data. |
overtr[..].pdf [52 KiB] HiDef png [430 KiB] Thumbnail [467 KiB] *.C file |
|
|
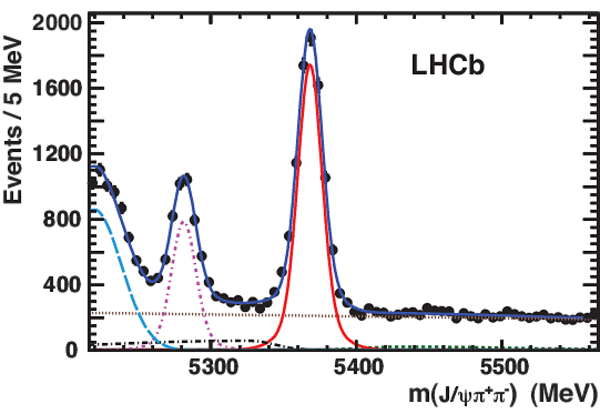
Mass distribution of the selected $ { J \mskip -3mu/\mskip -2mu\psi \mskip 2mu} \pi^+\pi^-$ combinations in the $f_{\rm odd}$ region. The blue solid curve shows the result of a fit with a double Gaussian signal (red solid curve) and several background components: combinatorial background (brown dotted line), background from $B^-\rightarrow { J \mskip -3mu/\mskip -2mu\psi \mskip 2mu} K^-$ and $ { J \mskip -3mu/\mskip -2mu\psi \mskip 2mu} \pi^-$ (green short-dashed line), $\overline{ B }{} ^0 \rightarrow { J \mskip -3mu/\mskip -2mu\psi \mskip 2mu} \pi^+\pi^-$ (purple dot-dashed), $\overline{ B }{} ^0_ s \rightarrow { J \mskip -3mu/\mskip -2mu\psi \mskip 2mu} \eta'$ and $\overline{ B }{} ^0_ s \rightarrow { J \mskip -3mu/\mskip -2mu\psi \mskip 2mu} \phi$ when $\phi\rightarrow \pi^+\pi^-\pi^0$ (black dot-long-dashed), and $\overline{ B }{} ^0 \rightarrow { J \mskip -3mu/\mskip -2mu\psi \mskip 2mu} K^- \pi^+$ (light-blue long-dashed). |
fitmas[..].pdf [40 KiB] HiDef png [448 KiB] Thumbnail [252 KiB] *.C file |
|
|
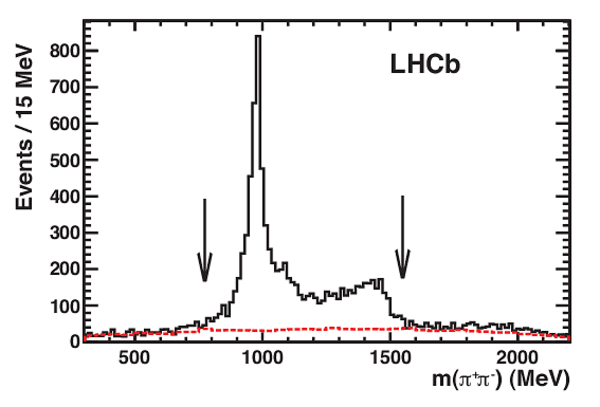
Mass distribution of selected $\pi^+\pi^-$ combinations shown as the (solid black) histogram for events in the $\overline{ B }{} ^0_ s $ signal region. The (dashed red) line shows the background determined by fitting the $ { J \mskip -3mu/\mskip -2mu\psi \mskip 2mu} \pi^+\pi^-$ mass in bins of $\pi^+\pi^-$ mass. The arrows designate the limits of the $f_{\rm odd}$ region. |
mpipi-BDT.pdf [34 KiB] HiDef png [286 KiB] Thumbnail [167 KiB] *.C file |
|
|
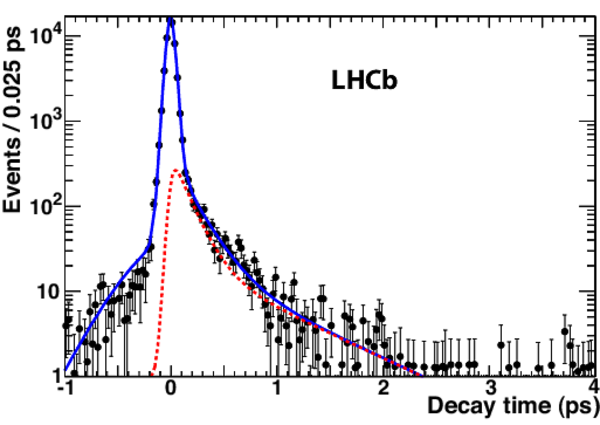
Decay time distribution of prompt $ { J \mskip -3mu/\mskip -2mu\psi \mskip 2mu} \pi^+\pi^-$ candidates in the $f_0$ region. The dashed (red) line shows the long-lived component, and the solid curve the total. |
fit2-f0.pdf [42 KiB] HiDef png [218 KiB] Thumbnail [188 KiB] *.C file |
|
|
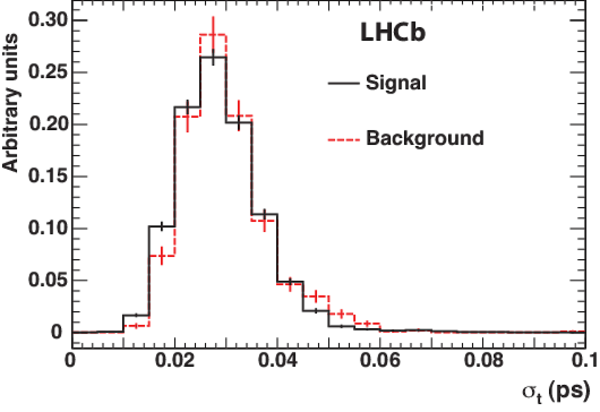
Distribution of the estimated time resolution $\sigma_t$ for opposite-sign $ { J \mskip -3mu/\mskip -2mu\psi \mskip 2mu} \pi^+\pi^-$ signal events after background subtraction, and for like-sign background. |
cmp.pdf [35 KiB] HiDef png [137 KiB] Thumbnail [164 KiB] *.C file |
|
|
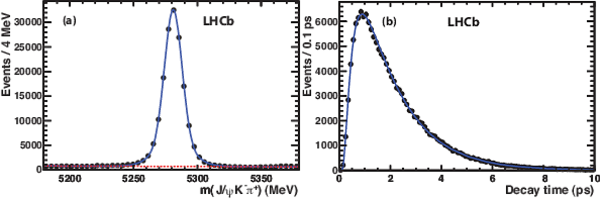
(a) Mass distribution of $\overline{ B }{} ^0 \rightarrow { J \mskip -3mu/\mskip -2mu\psi \mskip 2mu} \overline{ K }{} ^{*0} $ candidates. The dashed (red) line shows the background, and the solid (blue) curve the total. (b) Decay time distribution, where the small background has been subtracted using the $\overline{ B }{} ^0 $ mass sidebands. The (blue) curve shows the lifetime fit. |
mass-p[..].pdf [40 KiB] HiDef png [218 KiB] Thumbnail [142 KiB] *.C file |
|
|
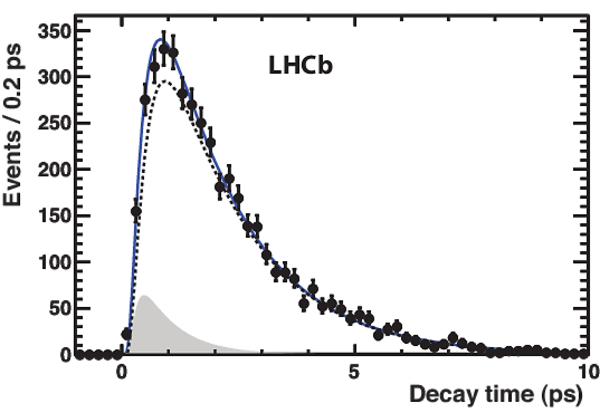
Decay time distribution of $\overline{ B }{} ^0_ s \rightarrow { J \mskip -3mu/\mskip -2mu\psi \mskip 2mu} f_0$ candidates fitted with a single exponential function multiplied by the acceptance and convolved with the resolution. The dashed line is signal and the shaded area background. |
fitlif[..].pdf [37 KiB] HiDef png [269 KiB] Thumbnail [191 KiB] *.C file |
|
|
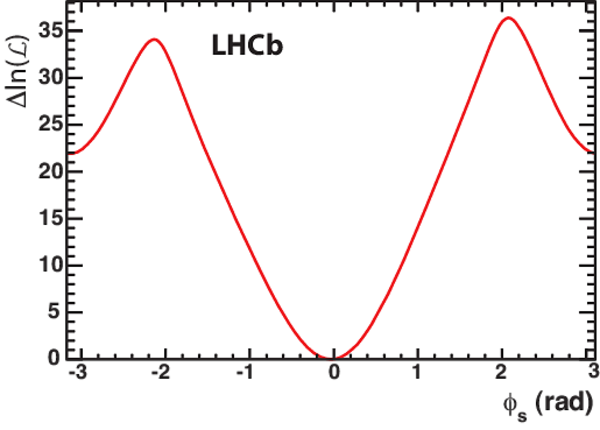
Log-likelihood difference as a function of $\phi_s$ for $\overline{ B }{} ^0_ s \rightarrow { J \mskip -3mu/\mskip -2mu\psi \mskip 2mu} f_{\rm odd}$ events. |
dll-dg[..].pdf [37 KiB] HiDef png [206 KiB] Thumbnail [158 KiB] *.C file |
|
|
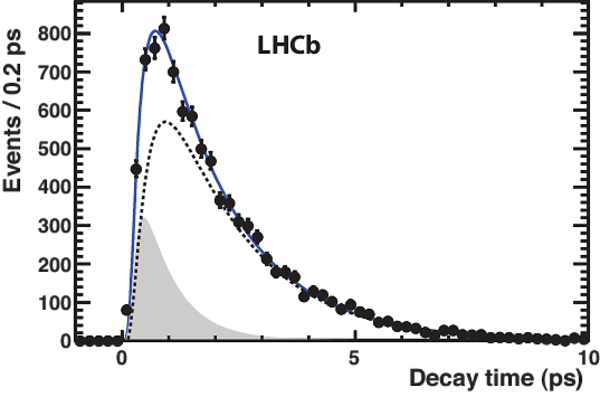
Decay time distribution of $\overline{ B }{} ^0_ s \rightarrow { J \mskip -3mu/\mskip -2mu\psi \mskip 2mu} f_{\rm odd}$ candidates. The solid line shows the result of the fit, the dashed line shows the signal, and the shaded region the background. |
time.pdf [37 KiB] HiDef png [262 KiB] Thumbnail [197 KiB] *.C file |
|
|
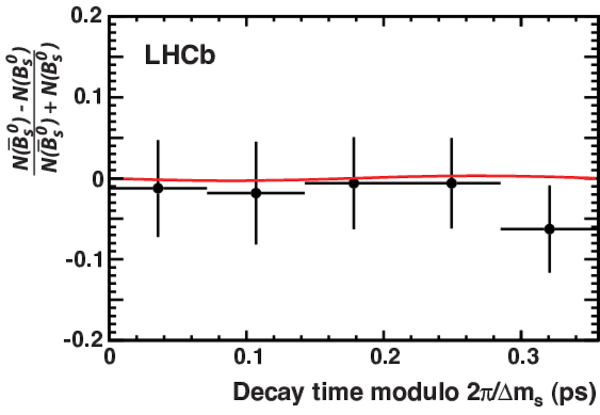
$ C P$ asymmetry as a function of decay time modulo $2\pi/\Delta m_s$. The curve shows the expectation for $\phi_s=-0.019$ rad. |
asym_modu.pdf [59 KiB] HiDef png [109 KiB] Thumbnail [115 KiB] *.C file |
|
|
Animated gif made out of all figures. |
PAPER-2012-006.gif Thumbnail |

|
![HiDef png [430 KiB]](Directory_LHCb-PAPER-2012-006/hidef_overtrain_BDT-a.png)
![HiDef png [448 KiB]](Directory_LHCb-PAPER-2012-006/hidef_fitmass_bdt_sel.png)
![HiDef png [286 KiB]](Directory_LHCb-PAPER-2012-006/hidef_mpipi-BDT.png)
![HiDef png [218 KiB]](Directory_LHCb-PAPER-2012-006/hidef_fit2-f0.png)
![HiDef png [137 KiB]](Directory_LHCb-PAPER-2012-006/hidef_cmp.png)
![HiDef png [218 KiB]](Directory_LHCb-PAPER-2012-006/hidef_mass-psikst.png)
![HiDef png [269 KiB]](Directory_LHCb-PAPER-2012-006/hidef_fitlifetime.png)
![HiDef png [206 KiB]](Directory_LHCb-PAPER-2012-006/hidef_dll-dgp-blind.png)
![HiDef png [262 KiB]](Directory_LHCb-PAPER-2012-006/hidef_time.png)
![HiDef png [109 KiB]](Directory_LHCb-PAPER-2012-006/hidef_asym_modu.png)
Tables and captions
|
Resonance fractions in $\overline{ B }{} ^0_ s \rightarrow { J \mskip -3mu/\mskip -2mu\psi \mskip 2mu} \pi^+\pi^-$ over the full mass range [11]. The final-state helicity of the D-wave is denoted by $\Lambda$. Only statistical uncertainties are quoted. |
Table_1.pdf [45 KiB] HiDef png [65 KiB] Thumbnail [29 KiB] tex code |

|
|
Parameters of the decay time resolution function determined from fits to $ { J \mskip -3mu/\mskip -2mu\psi \mskip 2mu} \pi^+\pi^-$ prompt data samples. |
Table_2.pdf [44 KiB] HiDef png [91 KiB] Thumbnail [37 KiB] tex code |

|
|
Parameters used in the functions for the invariant mass and decay time describing the signal and background. These parameters are fixed to their central values in the fit for $\phi_s$. |
Table_3.pdf [64 KiB] HiDef png [55 KiB] Thumbnail [24 KiB] tex code |

|
|
Summary of systematic uncertainties on $\phi_s$. Quantities fixed in the fit that are not included here give negligible uncertainties. The total uncertainty is found by adding in quadrature all the positive and negative contributions separately. |
Table_4.pdf [66 KiB] HiDef png [110 KiB] Thumbnail [49 KiB] tex code |

|
![HiDef png [65 KiB]](Directory_LHCb-PAPER-2012-006/hidef_Table_1.png)
![HiDef png [91 KiB]](Directory_LHCb-PAPER-2012-006/hidef_Table_2.png)
![HiDef png [55 KiB]](Directory_LHCb-PAPER-2012-006/hidef_Table_3.png)
![HiDef png [110 KiB]](Directory_LHCb-PAPER-2012-006/hidef_Table_4.png)
Created on 27 April 2024.