Strong constraints on the rare decays $B^0_s \to \mu^+ \mu^-$ and $B^0 \to \mu^+ \mu^-$
[to restricted-access page]Information
LHCb-PAPER-2012-007
CERN-PH-EP-2012-072
arXiv:1203.4493 [PDF]
(Submitted on 20 Mar 2012)
Phys. Rev. Lett. 108 (2012) 231801
Inspire 1094383
Tools
Abstract
A search for Bs -> mu+ mu- and B0 -> mu+ mu- decays is performed using 1.0 fb^-1 of pp collision data collected at \sqrt{s}=7 TeV with the LHCb experiment at the Large Hadron Collider. For both decays the number of observed events is consistent with expectation from background and Standard Model signal predictions. Upper limits on the branching fractions are determined to be BR(Bs -> mu+ mu-) < 4.5 (3.8) x 10^-9 and BR(B0 -> mu+ mu-) < 1.0 (0.81) x 10^-9 at 95 (90) confidence level.
Figures and captions
|
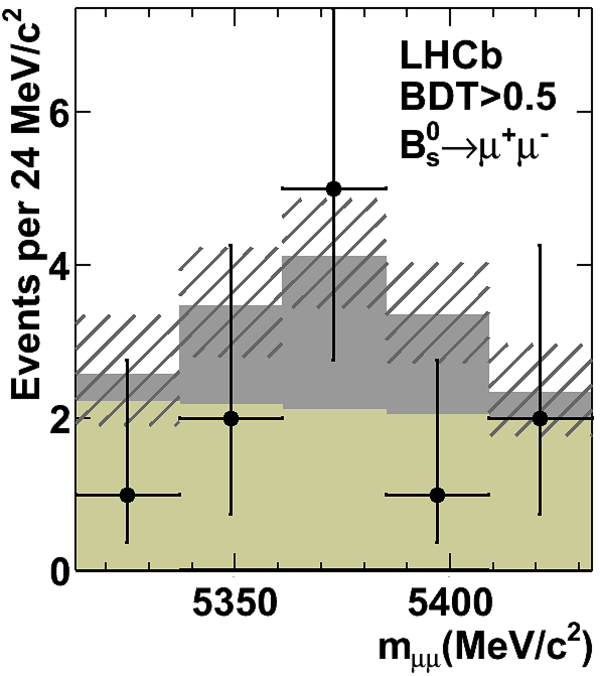
Distribution of selected candidates (black points) in the (left) $ B^0_s \to\mu^+\mu^-$ and (right) $ B^0\to\mu^+\mu^-$ mass window for BDT$>$0.5, and expectations for, from the top, $ B^{0}_{(s)}\to\mu^+\mu^-$ SM signal (gray), combinatorial background (light gray), $ B^0_{(s)}\to h^+{h'}^{-}$ background (black), and cross-feed of the two modes (dark gray). The hatched area depicts the uncertainty on the sum of the expected contributions. |
Fig1a.png [16 KiB] HiDef png [182 KiB] Thumbnail [78 KiB] *.C file |
|
|
Fig1b.png [16 KiB] HiDef png [179 KiB] Thumbnail [79 KiB] *.C file |

|
|
|
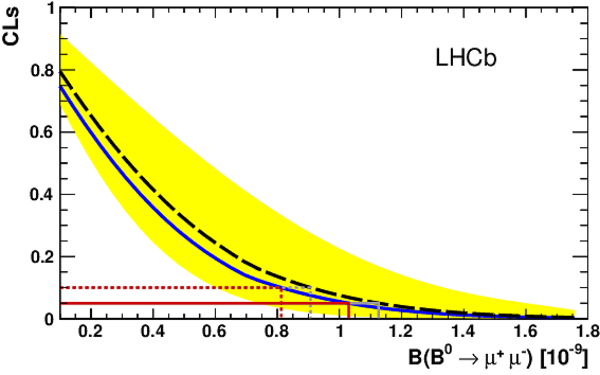
$\textrm{CL}_{\textrm{s}}$ as a function of the assumed $\cal B$ for (left) $ B^0_s \to\mu^+\mu^-$ and (right) $ B^0\to\mu^+\mu^-$ decays. The long dashed black curves are the medians of the expected $\textrm{CL}_{\textrm{s}}$ distributions for $ B^0_s \to\mu^+\mu^-$ , if background and SM signal were observed, and for $ B^0\to\mu^+\mu^-$ , if background only was observed. The yellow areas cover, for each $\cal B$ , 34% of the expected $\textrm{CL}_{\textrm{s}}$ distribution on each side of its median. The solid blue curves are the observed $\textrm{CL}_{\textrm{s}}$ . The upper limits at 90 % (95 %) CL are indicated by the dotted (solid) horizontal lines in red (dark gray) for the observation and in gray for the expectation. |
Fig2a.pdf [15 KiB] HiDef png [159 KiB] Thumbnail [126 KiB] *.C file |

|
|
Fig2b.pdf [14 KiB] HiDef png [155 KiB] Thumbnail [123 KiB] *.C file |
|
|
|
Animated gif made out of all figures. |
PAPER-2012-007.gif Thumbnail |

|
![Fig1a.png [16 KiB]](Directory_LHCb-PAPER-2012-007/Fig1a.png)
![HiDef png [182 KiB]](Directory_LHCb-PAPER-2012-007/hidef_Fig1a.png)
![Fig1b.png [16 KiB]](Directory_LHCb-PAPER-2012-007/Fig1b.png)
![HiDef png [179 KiB]](Directory_LHCb-PAPER-2012-007/hidef_Fig1b.png)
![HiDef png [159 KiB]](Directory_LHCb-PAPER-2012-007/hidef_Fig2a.png)
![HiDef png [155 KiB]](Directory_LHCb-PAPER-2012-007/hidef_Fig2b.png)
Tables and captions
|
Expected combinatorial background, $ B^0_{(s)}\to h^+{h'}^{-}$ background, cross-feed, and signal events assuming SM predictions, together with the number of observed events in the $ B^0_s \to\mu^+\mu^-$ and $ B^0\to\mu^+\mu^-$ mass signal regions, in bins of BDT. |
Table_1.pdf [55 KiB] HiDef png [91 KiB] Thumbnail [36 KiB] tex code |

|
|
Expected and observed limits on the $ B^{0}_{(s)}\to\mu^+\mu^-$ branching fractions. |
Table_2.pdf [53 KiB] HiDef png [63 KiB] Thumbnail [30 KiB] tex code |

|
![HiDef png [91 KiB]](Directory_LHCb-PAPER-2012-007/hidef_Table_1.png)
![HiDef png [63 KiB]](Directory_LHCb-PAPER-2012-007/hidef_Table_2.png)
Created on 27 April 2024.