Inclusive $W$ and $Z$ production in the forward region at $\sqrt{s}$ = 7 TeV
[to restricted-access page]Information
LHCb-PAPER-2012-008
CERN-PH-EP-2012-099
arXiv:1204.1620 [PDF]
(Submitted on 07 Apr 2012)
JHEP 06 (2012) 58
Inspire 1107729
Tools
Abstract
Measurements of inclusive $W$ and $Z$ boson production cross-sections in $pp$ collisions at $\sqrt{s}=7$ TeV using final states containing muons are presented. The data sample corresponds to an integrated luminosity of 37 pb$^{-1}$ collected with the LHCb detector. The $W$ and $Z$ bosons are reconstructed from muons with a transverse momentum above 20 GeV$/c$ and pseudorapidity between 2.0 and 4.5, and, in the case of the $Z$ cross-section, a dimuon invariant mass between 60 and 120 GeV$/c^2$. The cross-sections are measured to be {$831\pm9\pm27\pm 29$ pb} for $W^+$, {$656\pm8\pm19\pm 23$ pb} for $W^-$ and {$76.7\pm1.7\pm3.3\pm2.7$ pb} for $Z$, where the first uncertainty is statistical, the second is systematic and the third is due to the luminosity. Differential cross-sections, $W$ and $Z$ cross-section ratios and the lepton charge asymmetry are also measured in the same kinematic region. The ratios are determined to be $\sigma_{W^+\rightarrow\mu^+\nu} / \sigma_{W^-\rightarrow\mu^-\bar{\nu}}= ${$1.27\pm0.02\pm0.01$}, and $\sigma_{W^+\rightarrow\mu^+\nu} + \sigma_{W^-\rightarrow\mu^-\bar{\nu}})/\sigma_{Z\rightarrow\mu\mu}= ${$19.4\pm0.5\pm0.9$}. The results are in general agreement with theoretical predictions, performed at next-to-next-to-leading order in QCD using recently calculated parton distribution functions.
Figures and captions
|
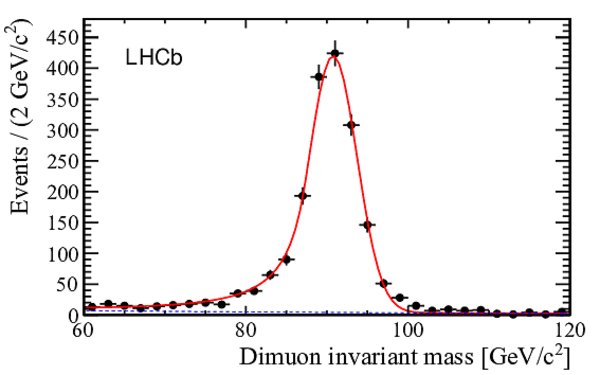
Invariant mass of the selected muon pairs. The fitted distribution to the data is shown as a solid line and the contribution from background and off-resonance Drell-Yan production as a dashed line. |
ZmassAll.pdf [47 KiB] HiDef png [167 KiB] Thumbnail [148 KiB] *.C file |
|
|
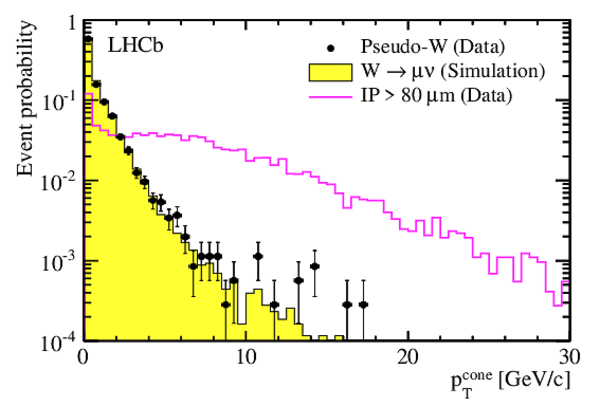
Distributions for $p_\mathrm{T}^\mathrm{cone}$ (top) and $E_\mathrm{T}^\mathrm{cone}$ (bottom). The points are for muons from pseudo-$W$ data, the yellow (shaded) histograms are for $W$-MC simulation, while the open histograms are for muons from QCD background with IP $>80$ $ \upmu\rm m$ from data. All distributions are normalised to unity. |
IsoCh.pdf [17 KiB] HiDef png [164 KiB] Thumbnail [148 KiB] *.C file |
|
|
IsoNt.pdf [17 KiB] HiDef png [170 KiB] Thumbnail [152 KiB] *.C file |

|
|
|
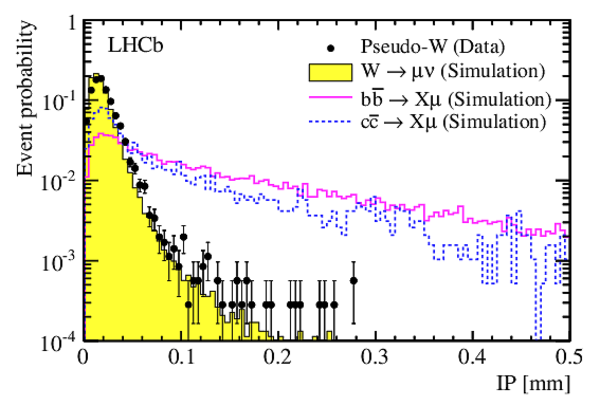
Muon IP distribution for pseudo-W events as points, $W$-MC as a yellow (shaded) histogram, and muons from simulated semi-leptonic decays of hadrons containing a $b$ quark in the full open histogram or a $c$ quark in the dashed open histogram. All distributions are normalised to unity. |
IP.pdf [19 KiB] HiDef png [257 KiB] Thumbnail [212 KiB] *.C file |
|
|
EoP.pdf [16 KiB] HiDef png [159 KiB] Thumbnail [144 KiB] *.C file |

|
|
|
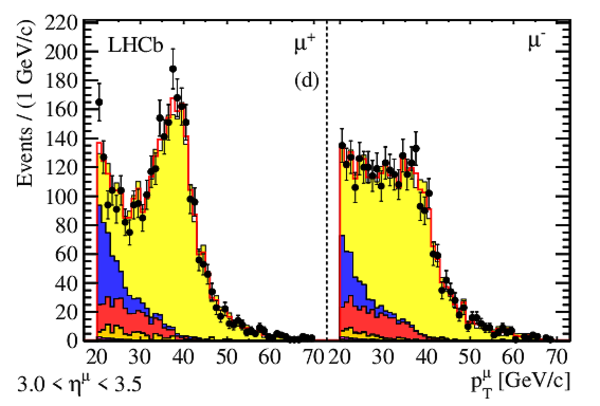
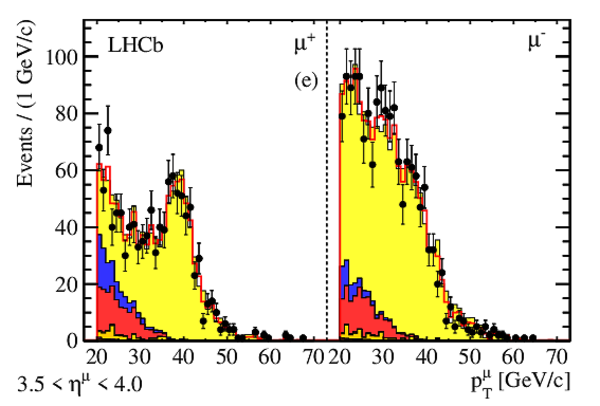
Distribution of muon $p_\mathrm{T}$ for positively (left panel) and negatively (right panel) charged muons in $W$ candidate events, for the total fiducial cross-section (a). The plots (b) to (f) give the same information for the different $\eta^\mu $ bins. The data (points) are compared to the fitted contributions from $W^-$ and $W^+$ (light shaded). The background contributions are, from top to bottom in the legend: decay-in-flight, $Z\rightarrow\mu\mu$ , $\tau$ decays of W and $Z$, and heavy flavour decays. |
TFF0.pdf [32 KiB] HiDef png [278 KiB] Thumbnail [232 KiB] *.C file |

|
|
TFF1.pdf [32 KiB] HiDef png [271 KiB] Thumbnail [210 KiB] *.C file |

|
|
|
TFF2.pdf [32 KiB] HiDef png [266 KiB] Thumbnail [210 KiB] *.C file |

|
|
|
TFF3.pdf [32 KiB] HiDef png [279 KiB] Thumbnail [226 KiB] *.C file |
|
|
|
TFF4.pdf [29 KiB] HiDef png [252 KiB] Thumbnail [199 KiB] *.C file |
|
|
|
TFF5.pdf [25 KiB] HiDef png [217 KiB] Thumbnail [183 KiB] *.C file |

|
|
|
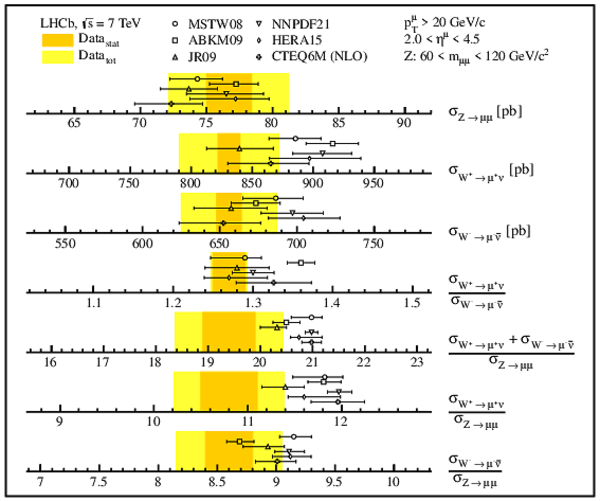
Measurements of the $Z$, $W^+$ and $W^-$ cross-section and ratios, data are shown as bands which the statistical (dark shaded/orange) and total (light hatched/yellow) errors. The measurements are compared to NNLO and NLO predictions with different PDF sets for the proton, shown as points with error bars. The PDF uncertainty, evaluated at the $68$% confidence level, and the theoretical uncertainties are added in quadrature to obtain the uncertainties of the predictions. |
Summary.pdf [19 KiB] HiDef png [454 KiB] Thumbnail [238 KiB] *.C file |
|
|
Differential cross-section for $Z\rightarrow\mu\mu$ as a function of $y^Z$. The dark shaded (orange) bands correspond to the statistical uncertainties, the light hatched (yellow) band to the statistical and systematic uncertainties added in quadrature. Superimposed are NNLO (NLO) predictions with different parametrisations for the PDF as points with error bars; they are displaced horizontally for presentation. |
CSZ.pdf [15 KiB] HiDef png [209 KiB] Thumbnail [141 KiB] *.C file |

|
|
CSW20.pdf [18 KiB] HiDef png [409 KiB] Thumbnail [185 KiB] *.C file |

|
|
|
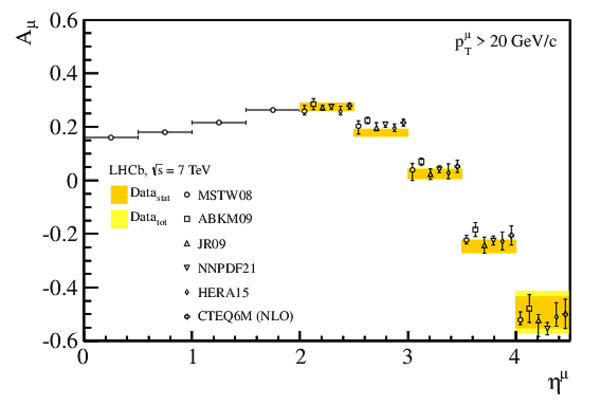
Lepton charge asymmetry $A_\mu=(\sigma_{W^+\rightarrow\mu^+\nu} -\sigma_{W^-\rightarrow\mu^-\bar{\nu}} )/(\sigma_{W^+\rightarrow\mu^+\nu} +\sigma_{W^-\rightarrow\mu^-\bar{\nu}} )$ in bins of muon pseudorapidity. The dark shaded (orange) bands correspond to the statistical uncertainties, the light hatched (yellow) band to the statistical and systematic uncertainties added in quadrature. Superimposed are NNLO (NLO) predictions as described in Fig 7. The MSTW08 values for $\eta^\mu <2$ represent the central value of the prediction. |
CSWA20.pdf [16 KiB] HiDef png [146 KiB] Thumbnail [110 KiB] *.C file |
|
|
$R_W=\sigma_{W^+\rightarrow\mu^+\nu} /\sigma_{W^-\rightarrow\mu^-\bar{\nu}} $ in bins of muon pseudorapidity. The dark shaded (orange) bands correspond to the statistical uncertainties, the light hatched (yellow) band to the statistical and systematic uncertainties added in quadrature. Superimposed are NNLO (NLO) predictions with different parametrisations as described in Fig 7. The MSTW08 values for $\eta^\mu <2$ represent the central value of the prediction. |
CSWR.pdf [16 KiB] HiDef png [150 KiB] Thumbnail [119 KiB] *.C file |

|
|
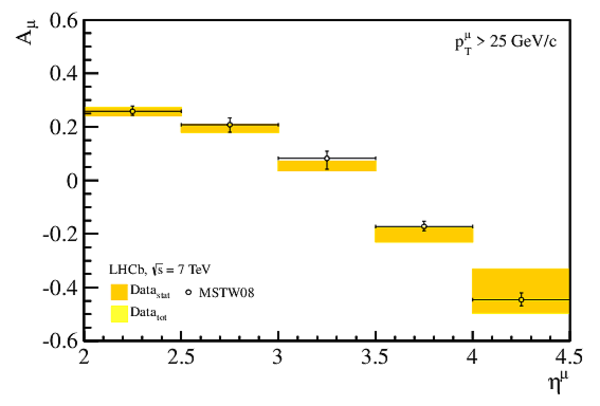
Lepton charge asymmetry $A_\mu=(\sigma_{W^+\rightarrow\mu^+\nu} -\sigma_{W^-\rightarrow\mu^-\bar{\nu}} )/(\sigma_{W^+\rightarrow\mu^+\nu} +\sigma_{W^-\rightarrow\mu^-\bar{\nu}} )$ for muons with $p^\mu_\mathrm{T} >$25 (top) and 30 $ {\mathrm{ Ge V /}c}$ (bottom), respectively in bins of muon pseudorapidity. The dark shaded (orange) bands correspond to the statistical uncertainties, the light hatched (yellow) band to the statistical and systematic uncertainties added in quadrature. The statistical uncertainty is undistinguishable from the total uncertainty. Superimposed are the NNLO predictions with the MSTW08 parametrisation for the PDF.\vspace*{1.5cm} |
CSWA25.pdf [14 KiB] HiDef png [90 KiB] Thumbnail [74 KiB] *.C file |
|
|
CSWA30.pdf [14 KiB] HiDef png [90 KiB] Thumbnail [74 KiB] *.C file |

|
|
|
Animated gif made out of all figures. |
PAPER-2012-008.gif Thumbnail |

|
![HiDef png [167 KiB]](Directory_LHCb-PAPER-2012-008/hidef_ZmassAll.png)
![HiDef png [164 KiB]](Directory_LHCb-PAPER-2012-008/hidef_IsoCh.png)
![HiDef png [170 KiB]](Directory_LHCb-PAPER-2012-008/hidef_IsoNt.png)
![HiDef png [257 KiB]](Directory_LHCb-PAPER-2012-008/hidef_IP.png)
![HiDef png [159 KiB]](Directory_LHCb-PAPER-2012-008/hidef_EoP.png)
![HiDef png [278 KiB]](Directory_LHCb-PAPER-2012-008/hidef_TFF0.png)
![HiDef png [271 KiB]](Directory_LHCb-PAPER-2012-008/hidef_TFF1.png)
![HiDef png [266 KiB]](Directory_LHCb-PAPER-2012-008/hidef_TFF2.png)
![HiDef png [279 KiB]](Directory_LHCb-PAPER-2012-008/hidef_TFF3.png)
![HiDef png [252 KiB]](Directory_LHCb-PAPER-2012-008/hidef_TFF4.png)
![HiDef png [217 KiB]](Directory_LHCb-PAPER-2012-008/hidef_TFF5.png)
![HiDef png [454 KiB]](Directory_LHCb-PAPER-2012-008/hidef_Summary.png)
![HiDef png [209 KiB]](Directory_LHCb-PAPER-2012-008/hidef_CSZ.png)
![HiDef png [409 KiB]](Directory_LHCb-PAPER-2012-008/hidef_CSW20.png)
![HiDef png [146 KiB]](Directory_LHCb-PAPER-2012-008/hidef_CSWA20.png)
![HiDef png [150 KiB]](Directory_LHCb-PAPER-2012-008/hidef_CSWR.png)
![HiDef png [90 KiB]](Directory_LHCb-PAPER-2012-008/hidef_CSWA25.png)
![HiDef png [90 KiB]](Directory_LHCb-PAPER-2012-008/hidef_CSWA30.png)
Tables and captions
|
Contributions to the systematic uncertainty for the total $Z$ and $W$ cross-sections. The different contributions are discussed in Sect. 4.6 |
Table_1.pdf [69 KiB] HiDef png [46 KiB] Thumbnail [22 KiB] tex code |

|
|
Correlation coefficients between $W^+$, $W^-$ and Z in the five bins considered. The luminosity uncertainty is not included. |
Table_2.pdf [41 KiB] HiDef png [78 KiB] Thumbnail [34 KiB] tex code |

|
|
Differential $Z\rightarrow \mu \mu$ cross-section, $d\sigma_{Z\rightarrow\mu\mu} /dy^Z$, in bins of boson rapidity. The first cross-section uncertainty is statistical, the second systematic, and the third due to the uncertainty on the luminosity determination. The correction factor $f^Z_{\mathrm{FSR}}$ which is used to correct for FSR is listed separately. |
Table_3.pdf [51 KiB] HiDef png [69 KiB] Thumbnail [30 KiB] tex code |

|
|
Lepton charge asymmetry, $A_\mu$, in bins of muon pseudorapidity for a $p^\mu_\mathrm{T} $ threshold at 20, 25 and 30 GeV/c. The first uncertainty is statistical and the second systematic. The effect of FSR is at the level of $10^{-4}$ and is not listed. |
Table_5.pdf [43 KiB] HiDef png [54 KiB] Thumbnail [23 KiB] tex code |

|
![HiDef png [46 KiB]](Directory_LHCb-PAPER-2012-008/hidef_Table_1.png)
![HiDef png [78 KiB]](Directory_LHCb-PAPER-2012-008/hidef_Table_2.png)
![HiDef png [69 KiB]](Directory_LHCb-PAPER-2012-008/hidef_Table_3.png)
![HiDef png [54 KiB]](Directory_LHCb-PAPER-2012-008/hidef_Table_5.png)
Created on 27 April 2024.