Measurement of the $D_s^+ - D_s^-$ production asymmetry in 7 TeV pp collisions
[to restricted-access page]Information
LHCb-PAPER-2012-009
CERN-PH-EP-2012-114
arXiv:1205.0897 [PDF]
(Submitted on 04 May 2012)
Phys. Lett. B713 (2012) 186
Inspire 1113593
Tools
Abstract
Heavy quark production in 7 TeV centre-of-mass energy pp collisions at the LHC is not necessarily flavour symmetric. The production asymmetry, A_P, between Ds+ and Ds- mesons is studied using the \phi\pi(+/-) decay mode in a data sample of 1.0/fb collected with the LHCb detector. The difference between \pi+ and \pi- detection efficiencies is determined using the ratios of fully reconstructed to partially reconstructed D*(+/-) decays. The overall production asymmetry in the Ds rapidity region 2.0 to 4.5 with transverse momentum larger than 2 GeV is measured to be A_P=(-0.33 +/- 0.22 +/- 0.10). This result can constrain models of heavy flavour production.
Figures and captions
|
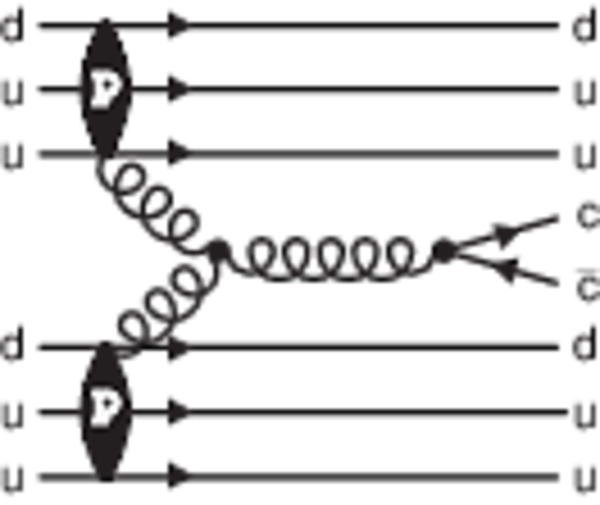
Production of $c\overline{c}$ quark pairs in a $pp$ collision via gluons. |
Ds-thy.pdf [58 KiB] HiDef png [265 KiB] Thumbnail [348 KiB] *.C file |
|
|
Distributions of mass differences in partial reconstruction for (a) RS $m(\pi ^+ _{s} K ^- \pi ^+\pi ^- )-m( K ^- \pi ^+\pi ^- )$ and (b) WS $m(\pi ^+ _{s} K ^+ \pi ^+\pi ^- )-m( K ^+ \pi ^+\pi ^- )$ candidates, for magnet up data. The (green) dotted line shows the signal, the (red) dashed line the background, and the (blue) solid line the total. The fit shapes are defined in Appendix A. |
mag_0_[..].pdf [87 KiB] HiDef png [321 KiB] Thumbnail [200 KiB] *.C file |

|
|
Distributions of the mass difference $\Delta m_{\text{full}}$ for (a) RS and (b) WS events using magnet up data. The (green) dotted line shows the signal, the (red) dashed line the background, and the (blue) solid line the total. The fit shapes are defined in Appendix B. |
mag_0_[..].pdf [67 KiB] HiDef png [223 KiB] Thumbnail [172 KiB] *.C file |

|
|
Distribution of fully reconstructed signal candidates for magnet up data as a function of pion (a) $p$ and (b) $p_{\rm T}$ . |
Contro[..].pdf [115 KiB] HiDef png [165 KiB] Thumbnail [122 KiB] *.C file |

|
|
Relative detection efficiency in bins of detected pion momentum: (red) circles represent data taken with magnet polarity up and (blue) squares show data taken with magnet polarity down. Only statistical errors are shown. |
relati[..].pdf [39 KiB] HiDef png [140 KiB] Thumbnail [199 KiB] *.C file |

|
|
Relative efficiency averaged over magnet up and magnet down samples versus pion $p$ and $p_{T}$. |
p_slic[..].pdf [56 KiB] HiDef png [95 KiB] Thumbnail [100 KiB] *.C file |

|
|
Azimuthal angle distribution of $\epsilon(\pi^+)/\epsilon(\pi^-)$ for magnet up data (red circles) and magnet down data (blue squares), and their average (black diamonds) for (a) pion momentum $2<p<20$ GeV and (b) $p>20$ GeV. |
effici[..].pdf [43 KiB] HiDef png [168 KiB] Thumbnail [175 KiB] *.C file |

|
|
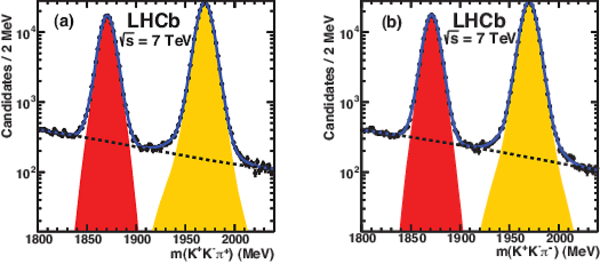
Invariant mass distributions for (a) $ K ^+ K ^- \pi ^+ $ and (b) $ K ^- K ^+ \pi ^- $ candidates, when $m(K^+K^-)$ is within $\pm$20 MeV of the $\phi$ mass, for the dataset taken with magnet polarity down. The shaded areas represent signal, the dashed line the background and the solid curve the total. |
Ds_mas[..].pdf [46 KiB] HiDef png [371 KiB] Thumbnail [240 KiB] *.C file |
|
|
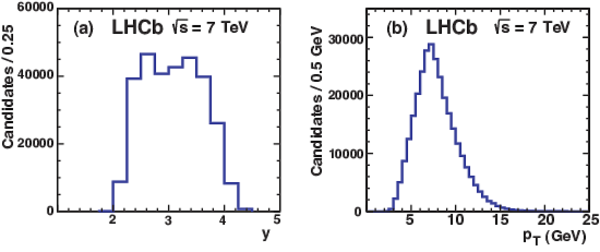
(a) $ D ^{\pm}_ s $ rapidity distribution (b) $ D ^{\pm}_ s $ $p_{T}$ distribution for background subtracted magnet up data. The statistical uncertainty on the number of events in each bin is smaller than the line thickness. |
Ds_Pt_[..].pdf [71 KiB] HiDef png [111 KiB] Thumbnail [125 KiB] *.C file |
|
|
Observed production asymmetry $A_{\rm P}$ as a function of (a) y, and (b) $p_{\rm T}$ . The errors shown are statistical only. |
Ap_total.pdf [77 KiB] HiDef png [117 KiB] Thumbnail [116 KiB] *.C file |

|
|
Animated gif made out of all figures. |
PAPER-2012-009.gif Thumbnail |

|
![HiDef png [265 KiB]](Directory_LHCb-PAPER-2012-009/hidef_Ds-thy.png)
![HiDef png [321 KiB]](Directory_LHCb-PAPER-2012-009/hidef_mag_0_phi_total_p_bin_0_pi_plus_part.png)
![HiDef png [223 KiB]](Directory_LHCb-PAPER-2012-009/hidef_mag_0_phi_total_p_bin_0_pi_plus_full.png)
![HiDef png [165 KiB]](Directory_LHCb-PAPER-2012-009/hidef_Control_sample_p-pt.png)
![HiDef png [140 KiB]](Directory_LHCb-PAPER-2012-009/hidef_relative_efficiency.png)
![HiDef png [95 KiB]](Directory_LHCb-PAPER-2012-009/hidef_p_slice_all.png)
![HiDef png [168 KiB]](Directory_LHCb-PAPER-2012-009/hidef_efficiency_ratio_vs_Phi.png)
![HiDef png [371 KiB]](Directory_LHCb-PAPER-2012-009/hidef_Ds_mass_fit_magdown_TOSonPhi.png)
![HiDef png [111 KiB]](Directory_LHCb-PAPER-2012-009/hidef_Ds_Pt_Rapidity_TosOnPhi.png)
![HiDef png [117 KiB]](Directory_LHCb-PAPER-2012-009/hidef_Ap_total.png)
Tables and captions
|
Event yields for partial and full reconstruction. |
Table_1.pdf [52 KiB] HiDef png [98 KiB] Thumbnail [44 KiB] tex code |

|
|
Fitted numbers of $D_s^{\pm}$ events for both magnet up and down data. |
Table_2.pdf [49 KiB] HiDef png [63 KiB] Thumbnail [27 KiB] tex code |

|
|
$A_{\rm P}$ (%) shown as a function of both $y$ and $p_{\rm T}$ . |
Table_3.pdf [34 KiB] HiDef png [50 KiB] Thumbnail [26 KiB] tex code |

|
![HiDef png [98 KiB]](Directory_LHCb-PAPER-2012-009/hidef_Table_1.png)
![HiDef png [63 KiB]](Directory_LHCb-PAPER-2012-009/hidef_Table_2.png)
![HiDef png [50 KiB]](Directory_LHCb-PAPER-2012-009/hidef_Table_3.png)
Created on 27 April 2024.