Measurement of the $B^0_s \rightarrow J/\psi \bar{K}^{*0}$ branching fraction and angular amplitudes
[to restricted-access page]Information
LHCb-PAPER-2012-014
CERN-PH-EP-2012-214
arXiv:1208.0738 [PDF]
(Submitted on 03 Aug 2012)
Phys. Rev. D86 (2012) 071102(R)
Inspire 1125853
Tools
Abstract
A search for the decay $B^0_s\rightarrow J/\psi K^{*0}$ with $K^{*0} \rightarrow K^-\pi^+$ is performed with 0.37 fb$^{-1}$ of $pp$ collisions at $\sqrt{s}$ = 7 TeV collected by the LHCb experiment, finding a $\Bs \to J\psi K^-\pi^+$ peak of $114 \pm 11$ signal events. The $K^-\pi^+$ mass spectrum of the candidates in the $B^0_s$ peak is dominated by the $K^{*0}$ contribution. Subtracting the non-resonant $K^-\pi^+$ component, the branching fraction of \BsJpsiKst is $(4.4_{-0.4}^{+0.5} \pm 0.8) \times 10^{-5}$, where the first uncertainty is statistical and the second systematic. A fit to the angular distribution of the decay products yields the \Kst polarization fractions $f_L = 0.50 \pm 0.08 \pm 0.02$ and $f_{||} = 0.19^{+0.10}_{-0.08} \pm 0.02$.
Figures and captions
|
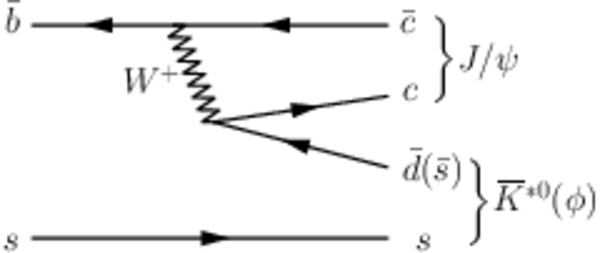
Tree and penguin decay topologies contributing to the decays $ B^0_s\rightarrow J/\psi \overline{ K }{} ^{*0} $ and $ B ^0_ s \rightarrow { J \mskip -3mu/\mskip -2mu\psi \mskip 2mu} \phi$. The dashed line indicates a colour singlet exchange. |
Fig1a.pdf [10 KiB] HiDef png [49 KiB] Thumbnail [72 KiB] *.C file |
|
|
Fig1b.pdf [11 KiB] HiDef png [60 KiB] Thumbnail [88 KiB] *.C file |

|
|
|
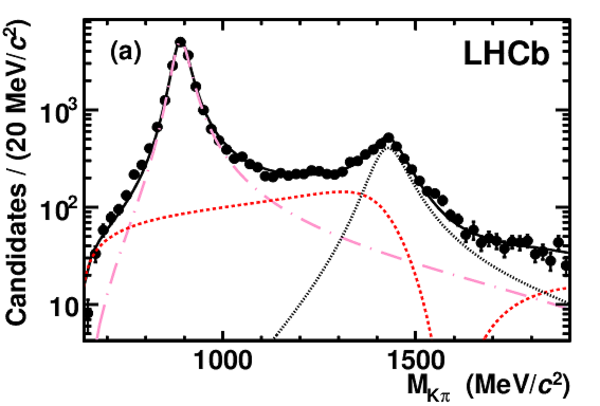
Fit to the $K\pi$ mass spectrum for (a) $ B ^0 \rightarrow J/\psi K \pi$ events, and (b) $ B^0_s\rightarrow J/\psi K \pi$ events. The $ B^0_{(s)}\rightarrow J/\psi K \pi$ yields in each bin of $K\pi$ mass are determined from a fit to the $ { J \mskip -3mu/\mskip -2mu\psi \mskip 2mu} K \pi$ mass spectrum. The pink dashed-dotted line represents the $ K ^{*0}$ , the red short-dashed line is the {S-wave} and the black dotted line is the $K^{*}_2(1430)$. The black solid line is their sum. |
Fig2a.pdf [22 KiB] HiDef png [201 KiB] Thumbnail [180 KiB] *.C file |
|
|
Fig2b.pdf [17 KiB] HiDef png [199 KiB] Thumbnail [175 KiB] *.C file |

|
|
|
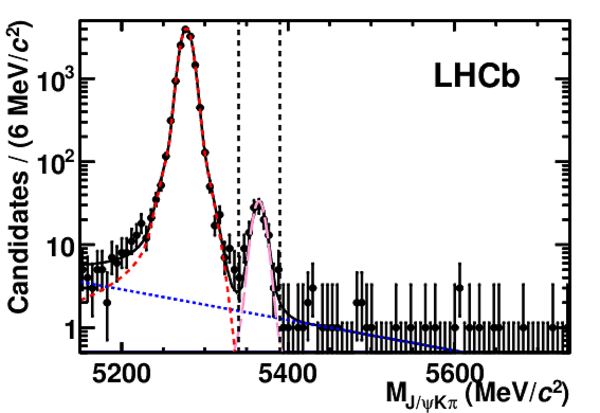
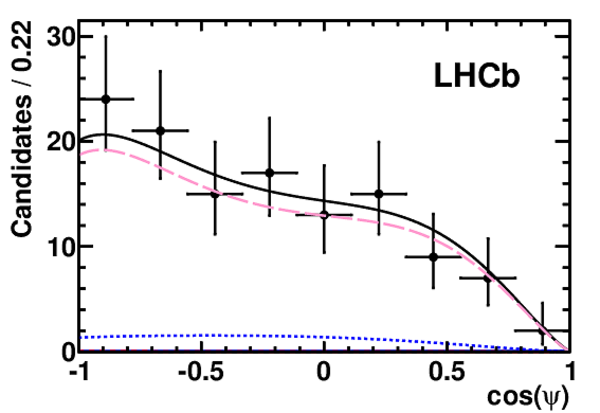
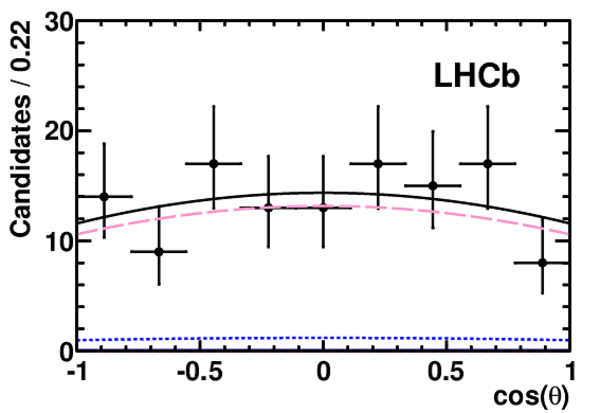
Projections of the fit in $M_{J/\psi K\pi}$ and in the angular variables for the mass range indicated by the two dashed vertical lines in the mass plot. The red dashed, pink long-dashed, and blue dotted lines represent the fitted contributions from $ B ^0 \rightarrow J/\psi K^{*0}$ , $ B^0_s\rightarrow J/\psi \overline{ K }{} ^{*0} $ and background. The black solid line is their sum. |
Fig3a.pdf [24 KiB] HiDef png [232 KiB] Thumbnail [204 KiB] *.C file |
|
|
Fig3b.pdf [16 KiB] HiDef png [160 KiB] Thumbnail [135 KiB] *.C file |
|
|
|
Fig3c.pdf [16 KiB] HiDef png [148 KiB] Thumbnail [127 KiB] *.C file |
|
|
|
Fig3d.pdf [16 KiB] HiDef png [147 KiB] Thumbnail [124 KiB] *.C file |

|
|
|
Animated gif made out of all figures. |
PAPER-2012-014.gif Thumbnail |

|
![HiDef png [49 KiB]](Directory_LHCb-PAPER-2012-014/hidef_Fig1a.png)
![HiDef png [60 KiB]](Directory_LHCb-PAPER-2012-014/hidef_Fig1b.png)
![HiDef png [201 KiB]](Directory_LHCb-PAPER-2012-014/hidef_Fig2a.png)
![HiDef png [199 KiB]](Directory_LHCb-PAPER-2012-014/hidef_Fig2b.png)
![HiDef png [232 KiB]](Directory_LHCb-PAPER-2012-014/hidef_Fig3a.png)
![HiDef png [160 KiB]](Directory_LHCb-PAPER-2012-014/hidef_Fig3b.png)
![HiDef png [148 KiB]](Directory_LHCb-PAPER-2012-014/hidef_Fig3c.png)
![HiDef png [147 KiB]](Directory_LHCb-PAPER-2012-014/hidef_Fig3d.png)
Tables and captions
|
Summary of the measured $ B^0_s\rightarrow J/\psi \overline{ K }{} ^{*0} $ angular properties and their statistical and systematic uncertainties. |
Table_1.pdf [57 KiB] HiDef png [78 KiB] Thumbnail [35 KiB] tex code |

|
|
Angular parameters of $ B ^0 \rightarrow J/\psi K^{*0}$ needed to compute $ {\cal B}(B^0_s\rightarrow J/\psi \overline{ K }{} ^{*0} )$ . The systematic uncertainties from background modelling and the mass $\rm PDF$ are found to be negligible in this case. |
Table_2.pdf [54 KiB] HiDef png [47 KiB] Thumbnail [21 KiB] tex code |

|
|
Parameter values and errors for $\frac{ {\cal B}(B^0_s\rightarrow J/\psi \overline{ K }{} ^{*0} ) }{ {\cal B}( B ^0 \rightarrow J/\psi K^{*0}) }$. |
Table_3.pdf [85 KiB] HiDef png [67 KiB] Thumbnail [32 KiB] tex code |

|
![HiDef png [78 KiB]](Directory_LHCb-PAPER-2012-014/hidef_Table_1.png)
![HiDef png [47 KiB]](Directory_LHCb-PAPER-2012-014/hidef_Table_2.png)
![HiDef png [67 KiB]](Directory_LHCb-PAPER-2012-014/hidef_Table_3.png)
Created on 27 April 2024.