Measurement of the fraction of $\Upsilon(1S)$ originating from $\chi_b(1P)$ decays in $pp$ collisions at $\sqrt{s}$ = 7 TeV
[to restricted-access page]Information
LHCb-PAPER-2012-015
CERN-PH-EP-2012-237
arXiv:1209.0282 [PDF]
(Submitted on 03 Sep 2012)
JHEP 11 (2012) 31
Inspire 1184177
Tools
Abstract
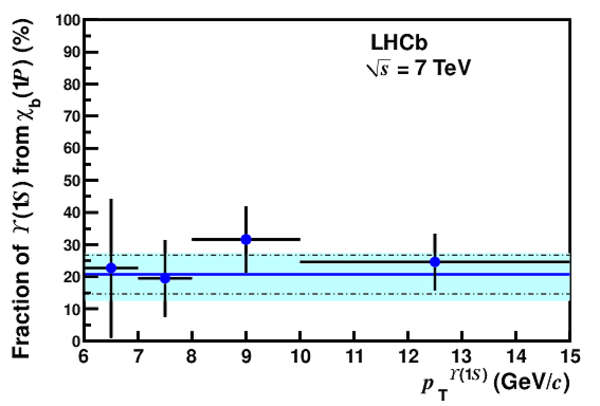
The production of \chib1P mesons in $pp$ collisions at a centre-of-mass energy of $7\tev$ is studied using $32\invpb$ of data collected with the \lhcb detector. The $\chib1P$ mesons are reconstructed in the decay mode $\chib1P \to \Y1S\g \to \mumu\g$. The fraction of \Y1S originating from \chib1P decays in the \Y1S transverse momentum range $6 < \pt^{\Y1S} < 15\gevc$ and rapidity range $2.0 < y^{\Y1S} < 4.5$ is measured to be $(20.7\pm 5.7\pm 2.1^{+2.7}_{-5.4})%$, where the first uncertainty is statistical, the second is systematic and the last gives the range of the result due to the unknown \Y1S and \chib1P polarizations.
Figures and captions
|
Distribution of the $\mu ^+\mu ^- $ mass for selected $\Upsilon(nS)$ candidates (black points), together with the result of the fit (solid blue curve), including the background (dotted blue curve) and the signal (dashed magenta curve) contributions. |
m2mu.eps [14 KiB] HiDef png [188 KiB] Thumbnail [145 KiB] *.C file |

|
|
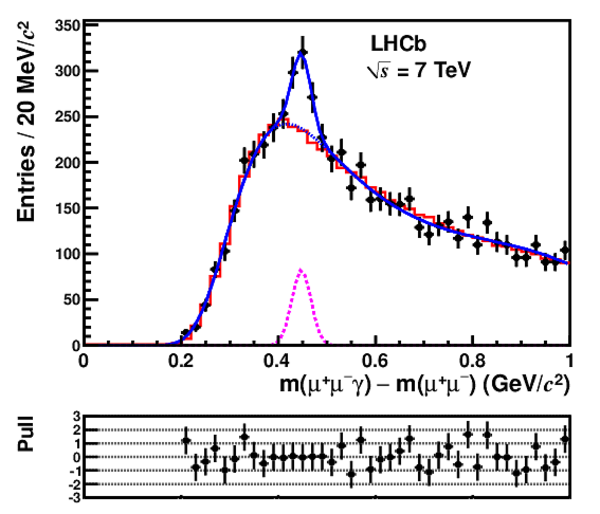
Distribution of the mass difference $m(\mu ^+\mu ^- \gamma ) - m(\mu ^+\mu ^- )$ for selected \chib1P candidates (black points), together with the result of the fit (solid blue curve), including background (dotted blue curve) and signal (dashed magenta curve) contributions. The solid (red) histogram is an alternative background estimation using simulated events containing a \Y1S that does not originate from a \chib1P decay, normalized to the data. It is used for evaluation of the systematic uncertainty due to the choice of fitting model. The bottom insert shows the pull distribution of the fit. The pull is defined as the difference between the data and fit value divided by the data error. |
dm2mug.eps [26 KiB] HiDef png [301 KiB] Thumbnail [242 KiB] *.C file |
|
|
Fraction of $\Y1S$ originating from $\chib1P$ decays for different $ p_{\rm T} ^{\Y1S}$ bins, assuming production of unpolarized $\Y1S$ and $\chib1P$ mesons, shown with solid circles. The vertical error bars are statistical only. The result determined for the range $6 < p_{\rm T} < 15 {\mathrm{ Ge V /}c} $ is shown with the horizontal solid line, its statistical uncertainty with the dash-dotted lines, and its total uncertainty (statistical and systematic, including that due to the unknown polarization) with the shaded (light blue) band. |
fra.eps [9 KiB] HiDef png [128 KiB] Thumbnail [127 KiB] *.C file |
|
|
Animated gif made out of all figures. |
PAPER-2012-015.gif Thumbnail |

|
![HiDef png [188 KiB]](Directory_LHCb-PAPER-2012-015/hidef_m2mu.png)
![HiDef png [301 KiB]](Directory_LHCb-PAPER-2012-015/hidef_dm2mug.png)
![HiDef png [128 KiB]](Directory_LHCb-PAPER-2012-015/hidef_fra.png)
Tables and captions
|
Number of reconstructed \chib1P and \Y1S signal candidates, conditional efficiency and fraction of \Y1S originating from \chib1P decays for different $ p_{\rm T} ^{\Y1S}$ bins. The uncertainties are statistical only. |
Table_1.pdf [45 KiB] HiDef png [46 KiB] Thumbnail [22 KiB] tex code |

|
|
Relative systematic uncertainties on the fraction of \Y1S originating from \chib1P decays. |
Table_2.pdf [18 KiB] HiDef png [51 KiB] Thumbnail [23 KiB] tex code |

|
![HiDef png [46 KiB]](Directory_LHCb-PAPER-2012-015/hidef_Table_1.png)
![HiDef png [51 KiB]](Directory_LHCb-PAPER-2012-015/hidef_Table_2.png)
Created on 26 April 2024.