Study of $D_{sJ}$ decays to $D^+K^0_{\rm S}$ and $D^0K^+$ final states in $pp$ collisions
[to restricted-access page]Information
LHCb-PAPER-2012-016
CERN-PH-EP-2012-181
arXiv:1207.6016 [PDF]
(Submitted on 25 Jul 2012)
JHEP 10 (2012) 151
Inspire 1123799
Tools
Abstract
A study of $D^+\KS$ and $D^0K^+$ final states is performed in a sample of 1.0/fb of $pp$ collision data collected at a centre-of-mass energy of $\sqrt{s}=7$ TeV with the \lhcb detector. We confirm the existence of the $D_{s1}^*(2700)^+$ and $D_{sJ}^*(2860)^+$ excited states and measure their masses and widths to be {eqnarray} m(D_{s1}^*(2700)^+) &=& 2709.2 \pm 1.9({stat})\pm 4.5({syst}) {MeV}/c^2,\cr \Gamma(D_{s1}^*(2700)^+) &=& 115.8 \pm 7.3({stat}) \pm12.1({syst}) {MeV}/c^2,\cr m(D_{sJ}^*(2860)^+) &=& 2866.1 \pm 1.0({stat}) \pm 6.3({syst}) {MeV}/c^2,\cr \Gamma(D_{sJ}^*(2860)^+) &=& 69.9 \pm 3.2({stat}) \pm 6.6({syst}) {MeV}/c^2.\cr {eqnarray}
Figures and captions
|
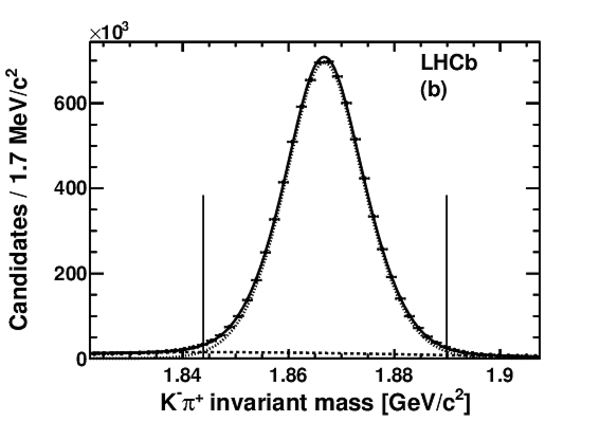
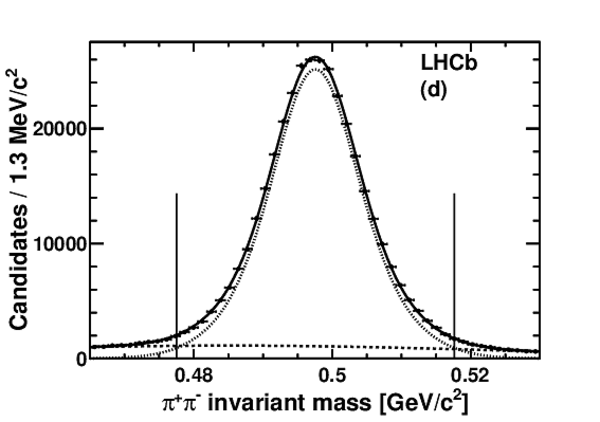
Invariant mass distribution (points) for (a) $D^+$, (b) $D^0$, $ K ^0_{\rm\scriptscriptstyle S} $ decaying (c) inside and (d) outside the vertex detector. We show the total probability density function (solid curve), the signal component as a sum of Gaussian distributions (dotted curve) and a decreasing exponential distribution to describe the background component (dashed curve). The region within the vertical lines corresponds to $\pm3$ standard deviations in mass resolution from the measured peak. |
Fig1a.pdf [19 KiB] HiDef png [131 KiB] Thumbnail [69 KiB] *.C file |

|
|
Fig1b.pdf [19 KiB] HiDef png [117 KiB] Thumbnail [61 KiB] *.C file |
|
|
|
Fig1c.pdf [19 KiB] HiDef png [115 KiB] Thumbnail [59 KiB] *.C file |

|
|
|
Fig1d.pdf [19 KiB] HiDef png [125 KiB] Thumbnail [64 KiB] *.C file |
|
|
|
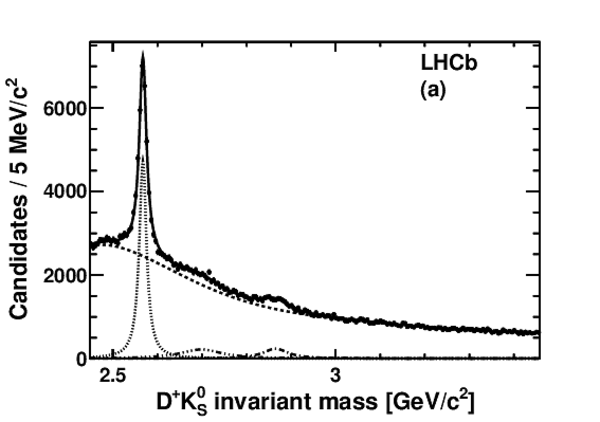
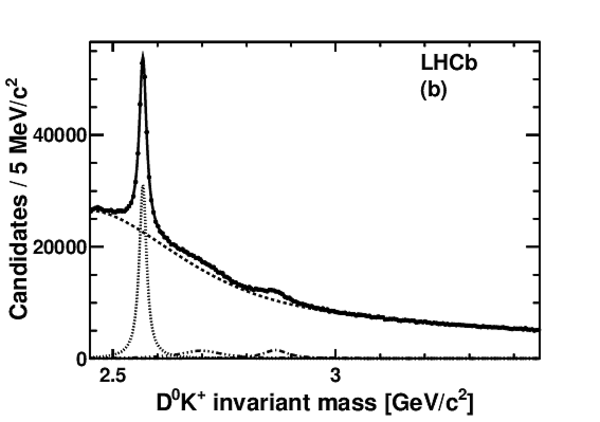
Invariant mass distributions for (a) $D^+ K ^0_{\rm\scriptscriptstyle S} $ and (b) $D^0K^+$. |
Fig2a.pdf [18 KiB] HiDef png [82 KiB] Thumbnail [44 KiB] *.C file |

|
|
Fig2b.pdf [18 KiB] HiDef png [85 KiB] Thumbnail [46 KiB] *.C file |

|
|
|
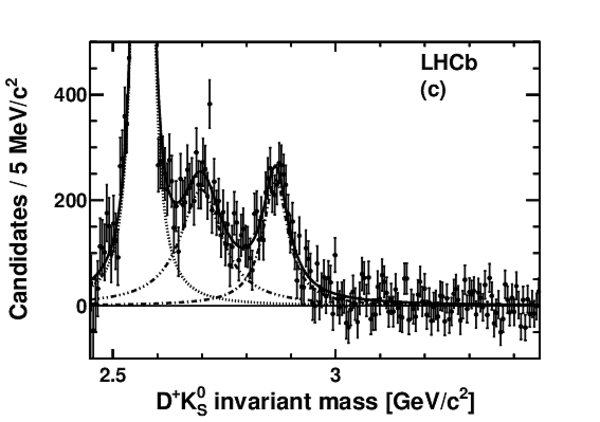
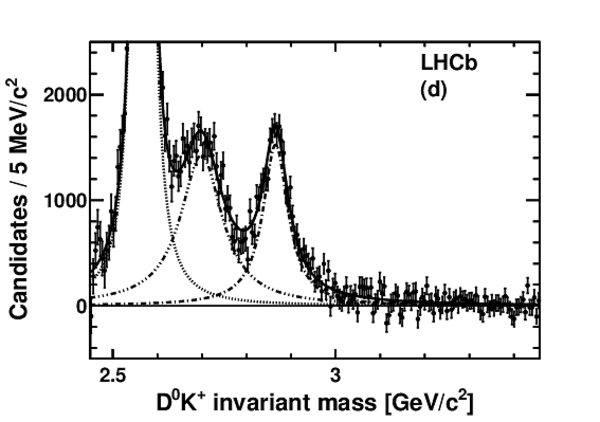
Invariant mass distributions (points) for (a) $D^+ K ^0_{\rm\scriptscriptstyle S} $ and (b) $D^0K^+$. We show the total simultaneous probability density function (solid line), the $D_{s2}^*(2573)^+$ (fine dotted line), $D_{s1}^*(2700)^+$ (dot-dot-dot dashed line), $D_{sJ}^*(2860)^+$ (dot dashed line) and background contribution (dashed line). Invariant mass distributions after combinatorial background subtraction are shown for (c) $D^+ K ^0_{\rm\scriptscriptstyle S} $ and (d) $D^0K^+$, where the vertical scales are truncated to show the $D_{s1}^*(2700)^+$ and $D_{sJ}^*(2860)^+$ signals more clearly. |
Fig3a.pdf [39 KiB] HiDef png [118 KiB] Thumbnail [62 KiB] *.C file |
|
|
Fig3b.pdf [39 KiB] HiDef png [110 KiB] Thumbnail [58 KiB] *.C file |
|
|
|
Fig3c.pdf [37 KiB] HiDef png [168 KiB] Thumbnail [97 KiB] *.C file |
|
|
|
Fig3d.pdf [37 KiB] HiDef png [163 KiB] Thumbnail [88 KiB] *.C file |
|
|
|
Animated gif made out of all figures. |
PAPER-2012-016.gif Thumbnail |

|
![HiDef png [131 KiB]](Directory_LHCb-PAPER-2012-016/hidef_Fig1a.png)
![HiDef png [117 KiB]](Directory_LHCb-PAPER-2012-016/hidef_Fig1b.png)
![HiDef png [115 KiB]](Directory_LHCb-PAPER-2012-016/hidef_Fig1c.png)
![HiDef png [125 KiB]](Directory_LHCb-PAPER-2012-016/hidef_Fig1d.png)
![HiDef png [82 KiB]](Directory_LHCb-PAPER-2012-016/hidef_Fig2a.png)
![HiDef png [85 KiB]](Directory_LHCb-PAPER-2012-016/hidef_Fig2b.png)
![HiDef png [118 KiB]](Directory_LHCb-PAPER-2012-016/hidef_Fig3a.png)
![HiDef png [110 KiB]](Directory_LHCb-PAPER-2012-016/hidef_Fig3b.png)
![HiDef png [168 KiB]](Directory_LHCb-PAPER-2012-016/hidef_Fig3c.png)
![HiDef png [163 KiB]](Directory_LHCb-PAPER-2012-016/hidef_Fig3d.png)
Tables and captions
|
Parameters for $D_{s1}^*(2700)^+$ and $D_{sJ}^*(2860)^+$ states, evaluated with binned fits to the samples. Masses and widths are given in units of $ {\mathrm{ Me V /}c^2}$ . Uncertainties are statistical only. |
Table_1.pdf [60 KiB] HiDef png [40 KiB] Thumbnail [19 KiB] tex code |

|
|
Total number of events for $D_{s1}^*(2700)^+$ and $D_{sJ}^*(2860)^+$, evaluated with the reference fit. Uncertainties are statistical only. |
Table_2.pdf [57 KiB] HiDef png [48 KiB] Thumbnail [23 KiB] tex code |

|
|
Systematic uncertainties for the $D_{s1}^*(2700)^+$ and $D_{sJ}^*(2860)^+$ parameters. Mass and width uncertainties, $\delta m$ and $\delta\Gamma$, are given in units of $ {\mathrm{ Me V /}c^2}$ . The total uncertainties are calculated as the quadratic sums of all contributions. |
Table_3.pdf [47 KiB] HiDef png [108 KiB] Thumbnail [51 KiB] tex code |

|
![HiDef png [40 KiB]](Directory_LHCb-PAPER-2012-016/hidef_Table_1.png)
![HiDef png [48 KiB]](Directory_LHCb-PAPER-2012-016/hidef_Table_2.png)
![HiDef png [108 KiB]](Directory_LHCb-PAPER-2012-016/hidef_Table_3.png)
Created on 27 April 2024.