Measurement of the $\bar{B}^0_s$ effective lifetime in the $J/\psi f_0(980)$ final state
[to restricted-access page]Information
LHCb-PAPER-2012-017
CERN-PH-EP-2012-180
arXiv:1207.0878 [PDF]
(Submitted on 04 Jul 2012)
Phys. Rev. Lett. 109 (2012) 152002
Inspire 1121120
Tools
Abstract
The effective lifetime of the Bs meson in the decay mode Bs->J/\psi f0(980) is measured using 1.0/fb of data collected in pp collisions at sqrt(s) = 7 TeV with the LHCb detector. The result is 1.700 +/- 0.040 +/- 0.026 ps where the first uncertainty is statistical and the second systematic. As the final state is CP-odd, and CP violation in this mode is measured to be small, the lifetime measurement can be translated into a measurement of the decay width of the heavy Bs mass eigenstate, \Gamma_H = (0.588 +/- 0.014 +/- 0.009)/ps.
Figures and captions
|
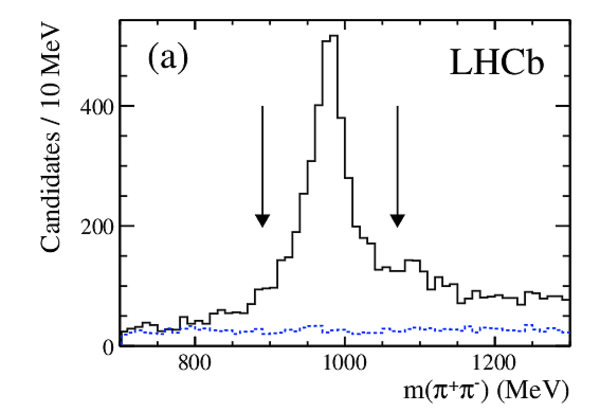
Invariant mass distributions of selected (a) $\pi ^+\pi ^-$ and (b) $ K ^- \pi ^+ $ combinations (solid histograms) for events within $\pm20$ MeV of the respective $\overline{ B }{} ^0_ s $ and $\overline{ B }{} ^0$ mass peaks. Backgrounds (dashed histograms) are determined by fitting the $ { J \mskip -3mu/\mskip -2mu\psi \mskip 2mu} \pi ^+\pi ^- $ ($ { J \mskip -3mu/\mskip -2mu\psi \mskip 2mu} K ^- \pi ^+ $) mass in bins of $\pi ^+\pi ^- $ ($ K ^- \pi ^+ $) mass. Regions between the arrows are used in the subsequent analysis. |
Fig1a.pdf [13 KiB] HiDef png [116 KiB] Thumbnail [108 KiB] *.C file |
|
|
Fig1b.pdf [13 KiB] HiDef png [116 KiB] Thumbnail [115 KiB] *.C file |

|
|
|
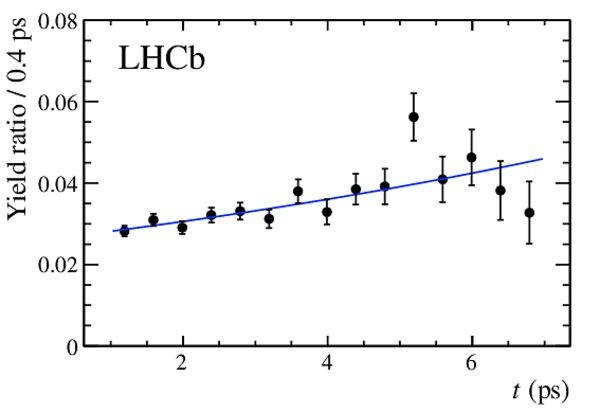
Ratio of decay time acceptances between $\overline{ B }{} ^0_ s \rightarrow { J \mskip -3mu/\mskip -2mu\psi \mskip 2mu} f_0(980)$ and $\overline{ B }{} ^0 \rightarrow { J \mskip -3mu/\mskip -2mu\psi \mskip 2mu} \overline{ K }{} ^{*0} $ decays obtained from simulation. The solid (blue) line shows the result of a linear fit. |
Fig2.pdf [18 KiB] HiDef png [173 KiB] Thumbnail [148 KiB] *.C file |

|
|
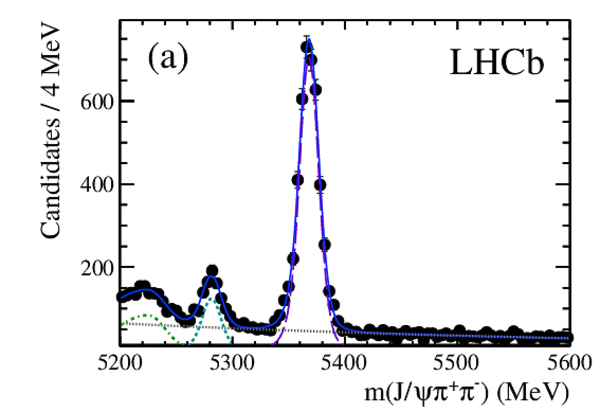
Invariant mass distributions of selected (a) $ { J \mskip -3mu/\mskip -2mu\psi \mskip 2mu} \pi ^+\pi ^- $ and (b) $ { J \mskip -3mu/\mskip -2mu\psi \mskip 2mu} K ^- \pi ^+ $ candidates. The solid (blue) curves show the total fits, the long dashed (purple) curves show the respective $\overline{ B }{} ^0_ s \rightarrow { J \mskip -3mu/\mskip -2mu\psi \mskip 2mu} f_0(980)$ and $\overline{ B }{} ^0 \rightarrow { J \mskip -3mu/\mskip -2mu\psi \mskip 2mu} \overline{ K }{} ^{*0} $ signals, and the dotted (gray) curve shows the combinatorial background. In (a) the short dashed (blue-green) curve shows the $\overline{ B }{} ^0 \rightarrow { J \mskip -3mu/\mskip -2mu\psi \mskip 2mu} \pi ^+\pi ^- $ background and the dash dotted (green) curve shows the $\overline{ B }{} ^0 \rightarrow { J \mskip -3mu/\mskip -2mu\psi \mskip 2mu} $ { $ K ^-$ $\pi ^+$ } reflection. In (b) the short dashed (red) curve near 5370 MeV shows the $\overline{ B }{} ^0_ s \rightarrow { J \mskip -3mu/\mskip -2mu\psi \mskip 2mu} K ^- \pi ^+ $ background. |
Fig3a.pdf [26 KiB] HiDef png [235 KiB] Thumbnail [164 KiB] *.C file |
|
|
Fig3b.pdf [25 KiB] HiDef png [183 KiB] Thumbnail [134 KiB] *.C file |

|
|
|
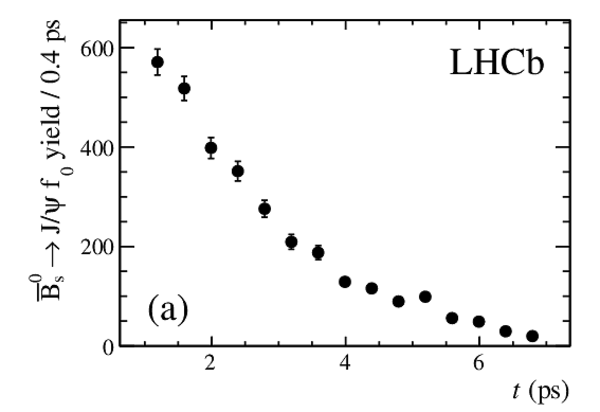
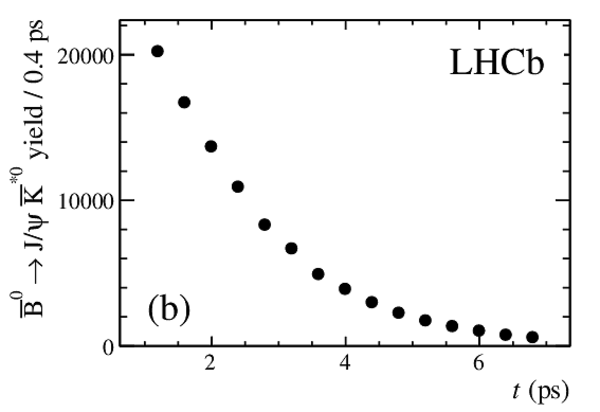
Decay time distributions for (a) $\overline{ B }{} ^0_ s \rightarrow { J \mskip -3mu/\mskip -2mu\psi \mskip 2mu} f_0(980)$ and (b) $\overline{ B }{} ^0 \rightarrow { J \mskip -3mu/\mskip -2mu\psi \mskip 2mu} \overline{ K }{} ^{*0} $ . In (b) the error bars are smaller than the points. |
Fig4a.pdf [13 KiB] HiDef png [65 KiB] Thumbnail [36 KiB] *.C file |
|
|
Fig4b.pdf [13 KiB] HiDef png [64 KiB] Thumbnail [35 KiB] *.C file |
|
|
|
Decay time ratio between $\overline{ B }{} ^0_ s \rightarrow { J \mskip -3mu/\mskip -2mu\psi \mskip 2mu} f_0(980)$ and $\overline{ B }{} ^0 \rightarrow { J \mskip -3mu/\mskip -2mu\psi \mskip 2mu} \overline{ K }{} ^{*0} $ , and the fit for $\Delta_{ { J \mskip -3mu/\mskip -2mu\psi \mskip 2mu} f_0 }$. |
Fig5.pdf [14 KiB] HiDef png [105 KiB] Thumbnail [93 KiB] *.C file |
|
|
Animated gif made out of all figures. |
PAPER-2012-017.gif Thumbnail |

|
![HiDef png [116 KiB]](Directory_LHCb-PAPER-2012-017/hidef_Fig1a.png)
![HiDef png [116 KiB]](Directory_LHCb-PAPER-2012-017/hidef_Fig1b.png)
![HiDef png [173 KiB]](Directory_LHCb-PAPER-2012-017/hidef_Fig2.png)
![HiDef png [235 KiB]](Directory_LHCb-PAPER-2012-017/hidef_Fig3a.png)
![HiDef png [183 KiB]](Directory_LHCb-PAPER-2012-017/hidef_Fig3b.png)
![HiDef png [65 KiB]](Directory_LHCb-PAPER-2012-017/hidef_Fig4a.png)
![HiDef png [64 KiB]](Directory_LHCb-PAPER-2012-017/hidef_Fig4b.png)
![HiDef png [105 KiB]](Directory_LHCb-PAPER-2012-017/hidef_Fig5.png)
Tables and captions
|
Summary of systematic uncertainties on the $\overline{ B }{} ^0_ s \rightarrow { J \mskip -3mu/\mskip -2mu\psi \mskip 2mu} f_0(980)$ effective lifetime. |
Table_1.pdf [32 KiB] HiDef png [109 KiB] Thumbnail [47 KiB] tex code |

|
![HiDef png [109 KiB]](Directory_LHCb-PAPER-2012-017/hidef_Table_1.png)
Created on 27 April 2024.