Measurement of the $C P$ asymmetry in $B^0 \to K^{*0} \mu^+ \mu^-$ decays
[to restricted-access page]Information
LHCb-PAPER-2012-021
CERN-PH-EP-2012-302
arXiv:1210.4492 [PDF]
(Submitted on 16 Oct 2012)
Phys. Rev. Lett. 110 (2013) 031801
Inspire 1190893
Tools
Abstract
A measurement of the CP asymmetry in B0 -> K*0 mu+ mu- decays is presented, based on 1.0fb-1 of pp collision data recorded by the LHCb experiment during 2011. The measurement is performed in six bins of invariant mass squared of the mu+ mu- pair, excluding the J/psi and psi(2S) resonance regions. Production and detection asymmetries are removed using the B0 -> J/Psi K*0 decay as a control mode. The integrated CP asymmetry is found to be -0.072 +- 0.040 (stat.) +- 0.005 (syst.), consistent with the Standard Model.
Figures and captions
|
Mass fits for $ B ^0 \rightarrow K^{*0} \mu^+ \mu^-$ decays used to extract the integrated $ C P$ asymmetry. The curves displayed are the full mass fit (blue, solid), the signal peak (red, short-dashed), and the background (grey, long-dashed). The mass fits on the top row correspond to the (a) $ B ^0$ and (b) $\overline{ B }{} ^0$ decays for one magnet polarity, while the bottom row shows the mass fits for (c) $ B ^0$ and (d) $\overline{ B }{} ^0$ for the reverse polarity. |
BdToKs[..].pdf [42 KiB] HiDef png [399 KiB] Thumbnail [305 KiB] *.C file |

|
|
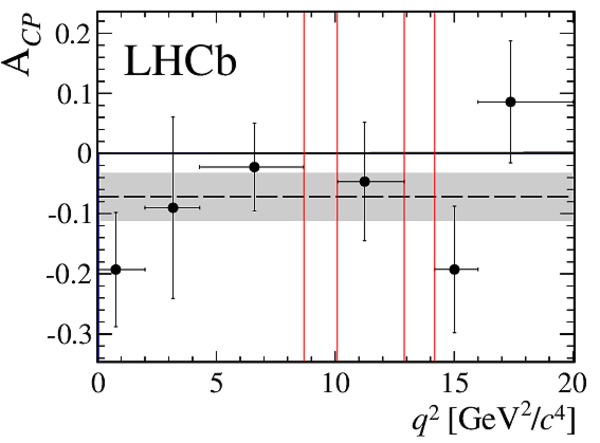
Fitted value of $ {\cal A}_{ C P }$ in $ B ^0 \rightarrow K^{*0} \mu^+ \mu^-$ decays in bins of the $\mu ^+\mu ^-$ invariant mass squared ( $ q^2$ ). The red vertical lines mark the charmonium vetoes. The points are plotted at the mean value of $ q^2$ in each bin. The uncertainties on each $ {\cal A}_{ C P }$ value are the statistical and systematic uncertainties added in quadrature. The dashed line corresponds to the $ q^2$ integrated value, and the grey band is the 1$\sigma$ uncertainty on this value. |
ACP_Bi[..].pdf [14 KiB] HiDef png [115 KiB] Thumbnail [106 KiB] *.C file |
|
|
Animated gif made out of all figures. |
PAPER-2012-021.gif Thumbnail |

|
![HiDef png [399 KiB]](Directory_LHCb-PAPER-2012-021/hidef_BdToKstarmumu_Integrated_Fit_New.png)
![HiDef png [115 KiB]](Directory_LHCb-PAPER-2012-021/hidef_ACP_Binned_Band.png)
Tables and captions
|
Systematic uncertainties on $ {\cal A}_{ C P }$ , from residual kinematic asymmetries, muon asymmetry, choice of signal model, and the modelling of the mass resolution, for each $ q^2$ bin. The total uncertainty is calculated by adding the individual uncertainties in quadrature. |
Table_1.pdf [40 KiB] HiDef png [100 KiB] Thumbnail [44 KiB] tex code |

|
|
Values of $ {\cal A}_{ C P }$ for $ B ^0 \rightarrow K^{*0} \mu^+ \mu^-$ in the $ q^2$ bins used in the analysis. |
Table_2.pdf [46 KiB] HiDef png [90 KiB] Thumbnail [42 KiB] tex code |

|
![HiDef png [100 KiB]](Directory_LHCb-PAPER-2012-021/hidef_Table_1.png)
![HiDef png [90 KiB]](Directory_LHCb-PAPER-2012-021/hidef_Table_2.png)
Created on 27 April 2024.