Evidence for the decay $B^0 \to J/\psi \omega$ and measurement of the relative branching fractions of $B^0_s$ meson decays to $J/\psi \eta$ and $J/\psi \eta'$
[to restricted-access page]Information
LHCb-PAPER-2012-022
CERN-PH-EP-2012-287
arXiv:1210.2631 [PDF]
(Submitted on 09 Oct 2012)
Nucl. Phys. B867 (2013) 547
Inspire 1189991
Tools
Abstract
First evidence of the $B^0\to J/\psi\omega$ decay is found and the $B_{s}^0\to J/\psi\eta$ and $B_{s}^0\to J/\psi\eta^{\prime}$ decays are studied using a dataset corresponding to an integrated luminosity of 1.0 $\mathrm{fb}^{-1}$ collected by the LHCb experiment in proton-proton collisions at a centre-of-mass energy of $\sqrt{s} = 7$ TeV. The branching fractions of these decays are measured relative to that of the $\mathrm{B}^0\to J/\psi\rho^0$ decay: $$\frac{Br(B^0\to J/\psi\omega)}{Br(B^0\to J/\psi\rho^0)} = 0.89 \pm0.19(stat)^{+0.07}_{-0.13}(syst)$$ $$\frac{Br(B^0_s\to J/\psi\eta)}{Br(B^0\to J/\psi\rho^0)} = 14.0 \pm 1.2(stat)^{+1.1}_{-1.5}(syst)^{+1.1}_{-1.0}(\frac{f_d}{f_s}),$$ $$\frac{Br(B^0_s\to J/\psi\eta^{\prime})}{Br(B^0\to J/\psi\rho^0)} = 12.7\pm1.1(stat)^{+0.5}_{-1.3}(syst)^{+1.0}_{-0.9}(\frac{f_d}{f_s}),$$ where the last uncertainty is due to the knowledge of $f_d/f_s$, the ratio of b-quark hadronization factors that accounts for the different production rate of $B^0$ and $B^0_s$ mesons. The ratio of the branching fractions of $B^0_s\to J/\psi\eta^{\prime}$ and $B^0_s\to J/\psi\eta$ decays is measured to be $$ \frac{Br(B^0_s\to J/\psi\eta^{\prime})}{Br(B^0_s\to J/\psi\eta)} = 0.90\pm0.09(stat)^{+0.06}_{-0.02}(syst).$$
Figures and captions
|
Examples of the dominant diagrams for the $\mathrm{B}^0_{\mathrm{(s)}}\rightarrow { J \mskip -3mu/\mskip -2mu\psi \mskip 2mu} \mathrm{X}^0$ decays (where $\mathrm{X}^0=\eta , \eta ^{\prime}, \omega $ or $\rho ^0$). |
Fig_1.pdf [66 KiB] HiDef png [37 KiB] Thumbnail [19 KiB] *.C file tex code |

|
|
Invariant mass distribution for selected $ B ^0 \rightarrow { J \mskip -3mu/\mskip -2mu\psi \mskip 2mu} \omega $ candidates. The black dots correspond to the data distribution, the thick solid blue line is the total fit function, the blue dashed line shows the background contribution and the orange thin line is the signal component of the fit function. |
Fig_2.pdf [71 KiB] HiDef png [185 KiB] Thumbnail [180 KiB] *.C file tex code |

|
|
Background-subtracted (a) $\gamma {}\gamma $ and (b) $\pi ^+\pi ^- {}\pi ^0 $ invariant mass distributions for $ B ^0 \rightarrow { J \mskip -3mu/\mskip -2mu\psi \mskip 2mu} \pi ^+\pi ^- \gamma\gamma$ decays. In both distributions the line is the result of the fit described in the text. |
Fig_3.pdf [96 KiB] HiDef png [166 KiB] Thumbnail [162 KiB] *.C file tex code |

|
|
Invariant mass distributions for selected $ B ^0_ s \rightarrow { J \mskip -3mu/\mskip -2mu\psi \mskip 2mu} \eta ^{\left(\prime\right)}$ candidates: (a) $ B ^0_ s \rightarrow { J \mskip -3mu/\mskip -2mu\psi \mskip 2mu} \eta \left(\eta \rightarrow \gamma {}\gamma \right)$, (b) $ B ^0_ s \rightarrow { J \mskip -3mu/\mskip -2mu\psi \mskip 2mu} \eta \left(\eta \rightarrow \pi ^+\pi ^- {}\pi ^0 \right)$, (c) $ B ^0_ s \rightarrow { J \mskip -3mu/\mskip -2mu\psi \mskip 2mu} \eta ^{\prime}\left(\eta ^{\prime}\rightarrow \rho ^0\gamma \right)$ and (d) $ B ^0_ s \rightarrow { J \mskip -3mu/\mskip -2mu\psi \mskip 2mu} \eta ^{\prime}\left(\eta ^{\prime}\rightarrow \pi ^+\pi ^- {}\eta \right)$. In all distributions the black dots show the data. The thin solid orange lines show the signal $ B ^0_ s $ contributions and the orange dot-dashed lines correspond to the $ B ^0 $ contributions. The blue dashed lines show the combinatorial background contributions and the dotted blue lines show the partially reconstructed background components. The total fit functions are drawn as solid blue lines. The results of the fit are described in the text. |
Fig_4.pdf [171 KiB] HiDef png [474 KiB] Thumbnail [405 KiB] *.C file tex code |

|
|
Background-subtracted invariant mass distributions for (a) $\gamma {}\gamma $ from $ B ^0_ s \rightarrow { J \mskip -3mu/\mskip -2mu\psi \mskip 2mu} \eta (\eta \rightarrow \gamma {}\gamma )$; (b) $\pi ^+\pi ^- {}\pi ^0 $ from $ B ^0_ s \rightarrow { J \mskip -3mu/\mskip -2mu\psi \mskip 2mu} \eta (\eta \rightarrow \pi ^+\pi ^- {}\pi ^0 )$; (c) and (d) $\pi ^+\pi ^- \gamma $ and $\pi ^+\pi ^- $ from $ B ^0_ s \rightarrow { J \mskip -3mu/\mskip -2mu\psi \mskip 2mu} \eta ^{\prime}(\eta ^{\prime}\rightarrow \rho ^0\gamma , \rho \rightarrow \pi ^+\pi ^- )$; (e) and (f) $\eta \pi ^+\pi ^- $ and $\gamma {}\gamma $ from $ B ^0_ s \rightarrow { J \mskip -3mu/\mskip -2mu\psi \mskip 2mu} \eta ^{\prime}(\eta ^{\prime}\rightarrow \eta \pi ^+\pi ^- )$. The purple line is the result of the fit described in the text. |
Fig_5.pdf [156 KiB] HiDef png [499 KiB] Thumbnail [465 KiB] *.C file tex code |

|
|
Invariant mass distribution for selected $\mathrm{B}^0_{\mathrm{(s)}}\rightarrow { J \mskip -3mu/\mskip -2mu\psi \mskip 2mu} \pi ^+\pi ^- $ candidates. The black dots show the data. The dot-dashed thin orange line shows the signal $ B ^0 $ contribution and the orange solid line shows the signal $ B ^0_ s $ contribution, a reflection from misidentified $ B ^0 \rightarrow { J \mskip -3mu/\mskip -2mu\psi \mskip 2mu} (\mathrm{K^*}\rightarrow \mathrm{K}\pi )$ is shown by a blue dotted line. The blue dashed line shows the background contribution. The total fit function is shown as a solid blue line. |
Fig_6.pdf [92 KiB] HiDef png [241 KiB] Thumbnail [164 KiB] *.C file tex code |

|
|
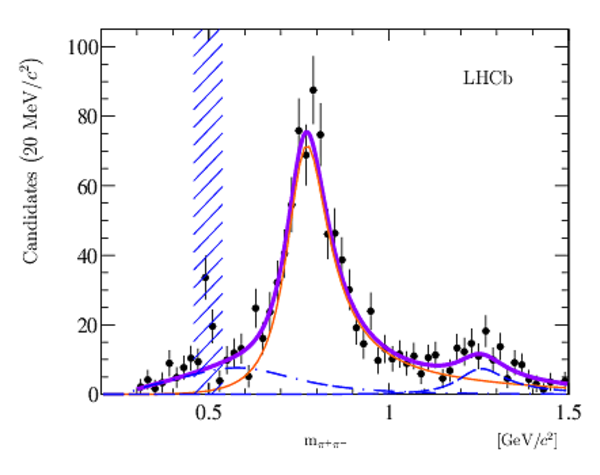
Background-subtracted $\pi ^+\pi ^-$ invariant mass distribution from $ B ^0 \rightarrow { J \mskip -3mu/\mskip -2mu\psi \mskip 2mu} \pi ^+\pi ^- $ decays. The black dots show the data. A violet solid line denotes the total fit function, the solid orange line shows the $\rho ^0$ signal contribution and the blue dashed line shows the $\mathrm{f}_2(1270)$ contribution. The blue dot-dashed line shows the contribution from the $\mathrm{f}_0(500)$. The region $\pm40 \mathrm{MeV/c}^2$ around the $\mathrm{K}^0_{\mathrm{S}}$ mass is excluded from the fit. |
Fig_7.pdf [86 KiB] HiDef png [254 KiB] Thumbnail [191 KiB] *.C file tex code |
|
|
Animated gif made out of all figures. |
PAPER-2012-022.gif Thumbnail |

|
![HiDef png [37 KiB]](Directory_LHCb-PAPER-2012-022/hidef_Fig_1.png)
![HiDef png [185 KiB]](Directory_LHCb-PAPER-2012-022/hidef_Fig_2.png)
![HiDef png [166 KiB]](Directory_LHCb-PAPER-2012-022/hidef_Fig_3.png)
![HiDef png [474 KiB]](Directory_LHCb-PAPER-2012-022/hidef_Fig_4.png)
![HiDef png [499 KiB]](Directory_LHCb-PAPER-2012-022/hidef_Fig_5.png)
![HiDef png [241 KiB]](Directory_LHCb-PAPER-2012-022/hidef_Fig_6.png)
![HiDef png [254 KiB]](Directory_LHCb-PAPER-2012-022/hidef_Fig_7.png)
Tables and captions
|
Signal yields, $\mathcal{Y}_{ B ^0_ s }$, the fitted $ B ^0_ s $ mass, $\mathrm{m}_{ B ^0_ s }$ and mass resolutions, $\sigma_{ B ^0_ s }$ for the $ B ^0_ s \rightarrow { J \mskip -3mu/\mskip -2mu\psi \mskip 2mu} {}\eta ^{\left(\prime\right)}$ decays. |
Table_1.pdf [94 KiB] HiDef png [58 KiB] Thumbnail [28 KiB] tex code |

|
|
Fitted yields of the $\rho ^0$ resonance, the relative yields of the $\mathrm{f}_2(1270)$ and $\mathrm{f}_0(500)$ components and probabilities, $\mathcal{P}$, of the fits to the uncorrected and efficiency-corrected $\pi ^+\pi ^-$ invariant mass distributions. |
Table_2.pdf [37 KiB] HiDef png [36 KiB] Thumbnail [16 KiB] tex code |

|
|
Branching fractions of the intermediate resonances, total efficiencies (excluding the branching fractions of the intermediate resonances), $\varepsilon^{\mathrm{tot}}$, and the photon and $\pi ^0$ efficiency correction factors $\eta^{\mathrm{corr}}$ for various channels. For the $ B ^0 \rightarrow { J \mskip -3mu/\mskip -2mu\psi \mskip 2mu} \rho ^0$ decay the total efficiency includes only the detector acceptance and trigger efficiencies, as the reconstruction and selection efficiency for this channel has been discussed in Sect. ???. |
Table_3.pdf [59 KiB] HiDef png [83 KiB] Thumbnail [41 KiB] tex code |

|
|
Relative systematic uncertainties for ratios of the branching fractions ($\mathcal{R}$) for the $ B ^0_ s \rightarrow { J \mskip -3mu/\mskip -2mu\psi \mskip 2mu} \eta ^{(\prime)}$ channels $\left[\%\right]$. |
Table_4.pdf [69 KiB] HiDef png [41 KiB] Thumbnail [19 KiB] tex code |

|
|
Systematic uncertainties for ratios of the branching fractions ($\mathcal{R}$) relative to $ B ^0 \rightarrow { J \mskip -3mu/\mskip -2mu\psi \mskip 2mu} \rho ^0$ $\left[\%\right]$. |
Table_5.pdf [76 KiB] HiDef png [41 KiB] Thumbnail [19 KiB] tex code |

|
![HiDef png [58 KiB]](Directory_LHCb-PAPER-2012-022/hidef_Table_1.png)
![HiDef png [36 KiB]](Directory_LHCb-PAPER-2012-022/hidef_Table_2.png)
![HiDef png [83 KiB]](Directory_LHCb-PAPER-2012-022/hidef_Table_3.png)
![HiDef png [41 KiB]](Directory_LHCb-PAPER-2012-022/hidef_Table_4.png)
![HiDef png [41 KiB]](Directory_LHCb-PAPER-2012-022/hidef_Table_5.png)
Created on 26 April 2024.