Search for the rare decay $K_{\rm\scriptscriptstyle S}^0\rightarrow\mu^{+}\mu^{-}$
[to restricted-access page]Information
LHCb-PAPER-2012-023
CERN-PH-EP-2012-267
arXiv:1209.4029 [PDF]
(Submitted on 18 Sep 2012)
JHEP 01 (2013) 90
Inspire 1186389
Tools
Abstract
A search for the decay KS -> mu+ mu- is performed, based on a data sample of 1.0 fb^-1 of pp collisions at \sqrt{s}=7 TeV collected by the LHCb experiment at the Large Hadron Collider. The observed number of candidates is consistent with the background-only hypothesis, yielding an upper limit of BR(KS -> mu+ mu-) < 11 (9) x 10^-9 at 95 (90) confidence level. This limit is a factor of thirty below the previous measurement.
Figures and captions
|
Mass spectrum for selected $ K ^0_{\rm\scriptscriptstyle S} \rightarrow \pi^+\pi^-$ candidates in the MB sample. The black points correspond to the mass reconstructed under the $\pi\pi$ mass hypothesis for the daughters, while the red triangles correspond to the mass reconstructed under the $\mu\mu$ mass hypothesis. |
Fig1.pdf [17 KiB] HiDef png [146 KiB] Thumbnail [142 KiB] *.C file |

|
|
Position in the $x-z$ plane of the secondary vertices of the background candidates found in the high mass sideband for (left) TIS candidates and (right) TOS candidates. The lighter coloured areas correspond to higher density of points. |
Fig2left.pdf [27 KiB] HiDef png [550 KiB] Thumbnail [467 KiB] *.C file |

|
|
Fig2right.pdf [39 KiB] HiDef png [803 KiB] Thumbnail [576 KiB] *.C file |

|
|
|
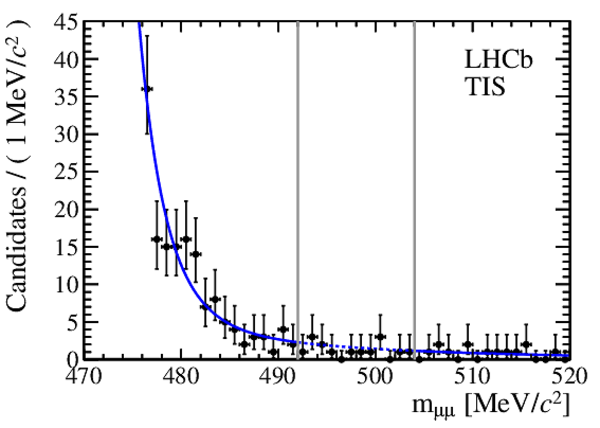
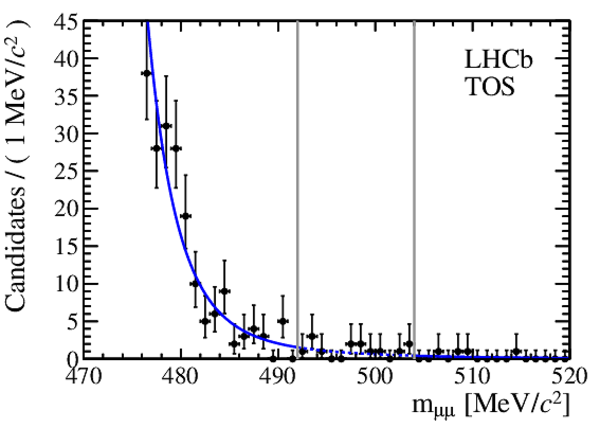
Background model fitted to the data separated along (left) TIS and (right) TOS trigger categories. The vertical lines delimit the search window. |
Fig3left.pdf [20 KiB] HiDef png [179 KiB] Thumbnail [172 KiB] *.C file |
|
|
Fig3right.pdf [20 KiB] HiDef png [176 KiB] Thumbnail [166 KiB] *.C file |
|
|
|
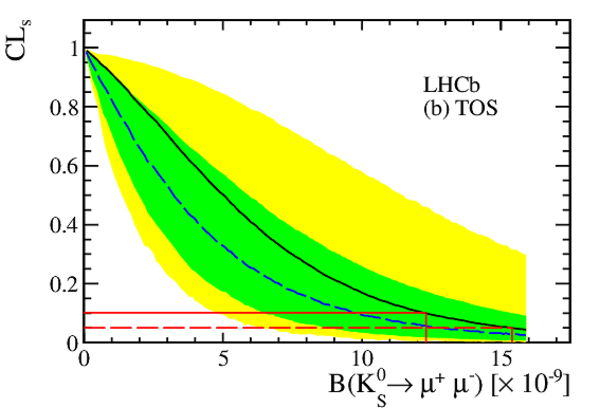
$\textrm{CL}_{\textrm{s}}$ curves for (a) TIS, (b) TOS categories and for (c) the combined sample. The solid line corresponds to the observed $\textrm{CL}_{\textrm{s}}$ . The dashed line corresponds to the median of the $\textrm{CL}_{\textrm{s}}$ for an ensemble of background-alone experiments. In each plot, two bands are shown. The green (dark) band covers $68\%$ ($1\sigma$) of the $\textrm{CL}_{\textrm{s}}$ curves obtained in the background only pseudo-experiments, while the yellow (light) band covers $95\%$ ($2\sigma$). |
Fig4a.pdf [15 KiB] HiDef png [153 KiB] Thumbnail [119 KiB] *.C file |

|
|
Fig4b.pdf [18 KiB] HiDef png [151 KiB] Thumbnail [122 KiB] *.C file |
|
|
|
Fig4c.pdf [14 KiB] HiDef png [144 KiB] Thumbnail [116 KiB] *.C file |

|
|
|
Animated gif made out of all figures. |
PAPER-2012-023.gif Thumbnail |

|
![HiDef png [146 KiB]](Directory_LHCb-PAPER-2012-023/hidef_Fig1.png)
![HiDef png [550 KiB]](Directory_LHCb-PAPER-2012-023/hidef_Fig2left.png)
![HiDef png [803 KiB]](Directory_LHCb-PAPER-2012-023/hidef_Fig2right.png)
![HiDef png [179 KiB]](Directory_LHCb-PAPER-2012-023/hidef_Fig3left.png)
![HiDef png [176 KiB]](Directory_LHCb-PAPER-2012-023/hidef_Fig3right.png)
![HiDef png [153 KiB]](Directory_LHCb-PAPER-2012-023/hidef_Fig4a.png)
![HiDef png [151 KiB]](Directory_LHCb-PAPER-2012-023/hidef_Fig4b.png)
![HiDef png [144 KiB]](Directory_LHCb-PAPER-2012-023/hidef_Fig4c.png)
Tables and captions
|
Upper limits on $ {\cal B}( K ^0_{\rm\scriptscriptstyle S} \rightarrow \mu^+\mu^-)$ for the TIS and the TOS categories separately, and for the combined analysis. The last entry in the table is the $p$-value of the background-only hypothesis. |
Table_1.pdf [39 KiB] HiDef png [40 KiB] Thumbnail [18 KiB] tex code |

|
![HiDef png [40 KiB]](Directory_LHCb-PAPER-2012-023/hidef_Table_1.png)
Created on 27 April 2024.