Measurement of the $D^\pm$ production asymmetry in 7 TeV $pp$ collisions
[to restricted-access page]Information
LHCb-PAPER-2012-026
CERN-PH-EP-2012-305
arXiv:1210.4112 [PDF]
(Submitted on 15 Oct 2012)
Phys. Lett. B718 (2013) 902
Inspire 1190679
Tools
Abstract
The asymmetry in the production cross-section \sigma of D+/- mesons, A_P = (\sigma(D+) - \sigma(D-))/(\sigma(D+) + \sigma(D-)), is measured in bins of pseudorapidity \eta and transverse momentum p_T within the acceptance of the LHCb detector. The result is obtained with a sample of D+ -> K_S pi+ decays corresponding to an integrated luminosity of 1.0 fb^-1, collected in pp collisions at a centre of mass energy of 7 TeV at the Large Hadron Collider. When integrated over the kinematic range 2.0 < p_T < 18.0 GeV/c and 2.20 < \eta < 4.75, the production asymmetry is A_P = (-0.96+/-0.26+/-0.18). The uncertainties quoted are statistical and systematic, respectively. The result assumes that any direct CP violation in the D+ -> K_S pi+ decay is negligible. No significant dependence on \eta or p_T is observed.
Figures and captions
|
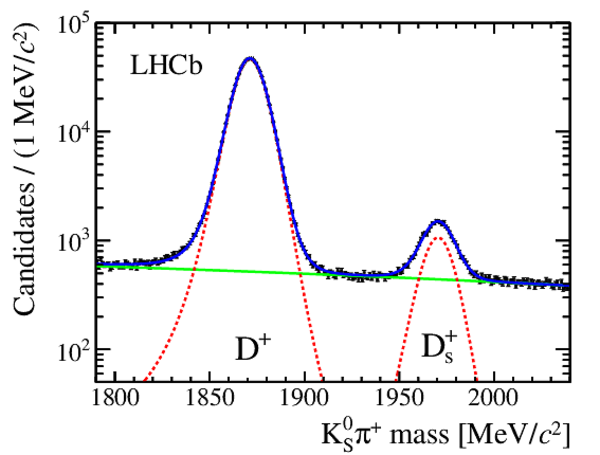
Mass distribution of selected $ K ^0_{\rm\scriptscriptstyle S} \pi ^+ $ candidates. The data are represented by symbols with error bars. The dashed curves indicate the signal and the $ D ^+_ s \rightarrow K ^0_{\rm\scriptscriptstyle S} \pi ^+ $ decays, the lower solid line represents the background shape, and the upper solid line shows the sum of all fit components. |
Fig1.pdf [43 KiB] HiDef png [237 KiB] Thumbnail [184 KiB] *.C file |
|
|
Background-subtracted distribution of transverse momenta $p_{\rm T}$ versus pseudorapidity $\eta$ for selected $ D ^+ \rightarrow K ^0_{\rm\scriptscriptstyle S} \pi ^+ $ candidates in a signal region of $1845 < m < 1890$ $ {\mathrm{ Me V /}c^2}$ . The bin marked with an asterisk is excluded from the weighted average over the production asymmetries in the bins used to obtain the final result. |
Fig2.pdf [34 KiB] HiDef png [708 KiB] Thumbnail [447 KiB] *.C file |

|
|
Observed $ K ^0_{\rm\scriptscriptstyle S}$ decay time distribution within the LHCb acceptance. The data points are fitted with an empirical function (solid curve). This contains a component for the upper decay time acceptance, due mainly to the requirement that the $ K ^0_{\rm\scriptscriptstyle S}$ decays inside the VELO (dashed curve) and a component for the lower decay time acceptance, due to the selection cuts (dotted curve). These are shown scaled by arbitrary factors. The CPV is not sensitive to the fine details of the distribution, so the fit quality is not important. |
Fig3.pdf [24 KiB] HiDef png [207 KiB] Thumbnail [162 KiB] *.C file |

|
|
Production asymmetry as a function of (a) transverse momentum $p_{\rm T}$ and (b) pseudorapidity $\eta$. The straight line fits have slopes of $(0.09\pm0.07) \times10^{-2}$ ( $ {\mathrm{ Ge V /}c}$ )$^{-1}$ and $(-0.36\pm0.28)$%, and values of $\chi^{2}$ per degree of freedom of $5.5/6$ and $2.2/4$, respectively. The error bars include only the statistical uncertainty on the $ D ^+$ signal sample and are uncorrelated within a given plot. |
Fig4a.pdf [14 KiB] HiDef png [119 KiB] Thumbnail [106 KiB] *.C file |

|
|
Fig4b.pdf [14 KiB] HiDef png [112 KiB] Thumbnail [103 KiB] *.C file |

|
|
|
Animated gif made out of all figures. |
PAPER-2012-026.gif Thumbnail |

|
![HiDef png [237 KiB]](Directory_LHCb-PAPER-2012-026/hidef_Fig1.png)
![HiDef png [708 KiB]](Directory_LHCb-PAPER-2012-026/hidef_Fig2.png)
![HiDef png [207 KiB]](Directory_LHCb-PAPER-2012-026/hidef_Fig3.png)
![HiDef png [119 KiB]](Directory_LHCb-PAPER-2012-026/hidef_Fig4a.png)
![HiDef png [112 KiB]](Directory_LHCb-PAPER-2012-026/hidef_Fig4b.png)
Tables and captions
|
Production asymmetry for $ D ^+$ mesons, in percent, in $( p_{\rm T} , \eta)$ bins, for $2.0 < p_{\rm T} < 18.0$ $ {\mathrm{ Ge V /}c}$ and $2.20 < \eta < 4.75$. The uncertainties shown are statistical only; the systematic uncertainty is $0.17\%$ (see Table 2). |
Table_1.pdf [34 KiB] HiDef png [81 KiB] Thumbnail [38 KiB] tex code |

|
|
Summary of absolute values of systematic uncertainties on $A_{\mathrm{P}}$. For the binned production asymmetries given in Table 1, all uncertainties except that on the reconstruction efficiency apply, giving a combined systematic uncertainty of 0.17%. |
Table_2.pdf [26 KiB] HiDef png [82 KiB] Thumbnail [37 KiB] tex code |

|
![HiDef png [81 KiB]](Directory_LHCb-PAPER-2012-026/hidef_Table_1.png)
![HiDef png [82 KiB]](Directory_LHCb-PAPER-2012-026/hidef_Table_2.png)
Created on 27 April 2024.