First observation of the $B_{s2}^\ast(5840)^0 \to B^{\ast+} K^-$ and studies of excited $B^0_s$ mesons
[to restricted-access page]Information
LHCb-PAPER-2012-030
CERN-PH-EP-2012-340
arXiv:1211.5994 [PDF]
(Submitted on 26 Nov 2012)
Phys. Rev. Lett. 110 (2013) 151803
Inspire 1203846
Tools
Abstract
Properties of the orbitally excited (L=1) $B_s$ states are studied using 1.0 fb$^{-1}$ of pp collisions at $\sqrt{s} =7$ TeV collected with the LHCb detector. The first observation of the $B_{s2}^*(5840)^0$ meson decaying to $B^{*+} K^-$ is reported, and the corresponding branching fraction measured relative to the $B^+ K^-$ decay mode. The $B_{s1}(5830)^0 \to B^{*+} K^-$ decay is observed as well. The width of the $B_{s2}^*(5840)^0$ state is measured for the first time and the masses of the two states are determined with the highest precision to date. The observation of the $B_{s2}^*(5840)^0 \to B^{*+} K^-$ decay favours the spin-parity assignment $J^P = 2^+$ for the $B_{s2}^*(5840)^0$ meson. In addition, the most precise measurement of the mass difference $m(B^{*+})-m(B^+) = 45.01 \pm 0.30 (stat) \pm 0.23 (syst)$ MeV/$c^2$ is obtained.
Figures and captions
|
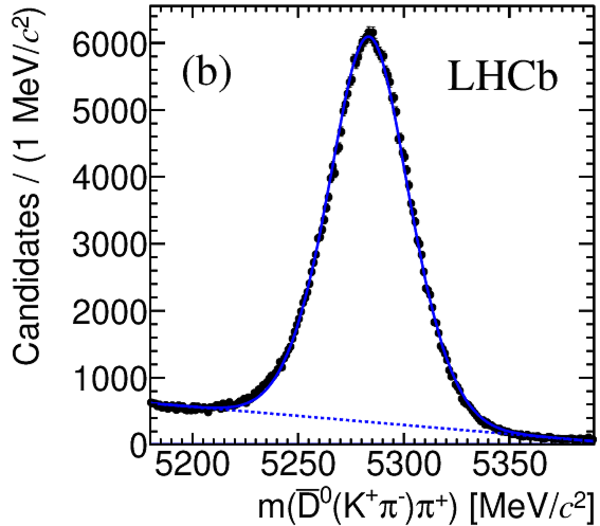
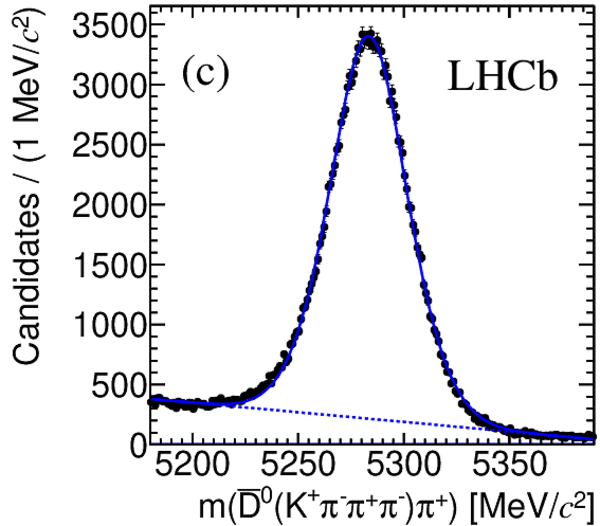
Invariant mass spectra of the final $ B ^+$ candidates. The signal lineshape is fitted with a double Gaussian distribution, while the background is modelled with a second order polynomial . (a) $ B ^+ \rightarrow J/\psi K ^+ $, (b) $ B ^+ \rightarrow \overline{ D }{} ^0 ( K ^+ \pi ^- ) \pi ^+ $, (c) $ B ^+ \rightarrow \overline{ D }{} ^0 ( K ^+ \pi ^- \pi ^+ \pi ^- ) \pi ^+ $, and (d) $ B ^+ \rightarrow \overline{ D }{} ^0 ( K ^+ \pi ^- ) \pi ^+ \pi ^- \pi ^+ $ decays. The $ { J \mskip -3mu/\mskip -2mu\psi \mskip 2mu}$ and $ D ^0$ masses are constrained to their world average values. |
Figure1a.eps [42 KiB] HiDef png [241 KiB] Thumbnail [226 KiB] *.C file |

|
|
Figure1b.eps [45 KiB] HiDef png [266 KiB] Thumbnail [254 KiB] *.C file |
|
|
|
Figure1c.eps [45 KiB] HiDef png [277 KiB] Thumbnail [266 KiB] *.C file |
|
|
|
Figure1d.eps [46 KiB] HiDef png [286 KiB] Thumbnail [277 KiB] *.C file |

|
|
|
Mass difference distribution $m( B ^+ K ^- )-m( B ^+ )-m( K ^- )$. The three peaks are identified as (left) $ B _{ s 1} \rightarrow B ^{*+} K ^- $, (middle) $ B ^{*}_{ s 2} \rightarrow B ^{*+} K ^- $, and (right) $ B ^{*}_{ s 2} \rightarrow B ^+ K ^- $. The total fit function is shown as a solid blue line, while the shaded red region is the spectrum of like-charge $ B ^+ K ^+ $ combinations. The inset shows an expanded view of the $ B _{ s 1} / B ^{*}_{ s 2} \rightarrow B ^{*+} K ^- $ signals. The bottom plot shows the fit pulls. |
Figure2.eps [124 KiB] HiDef png [366 KiB] Thumbnail [331 KiB] *.C file |

|
|
Animated gif made out of all figures. |
PAPER-2012-030.gif Thumbnail |

|
![HiDef png [241 KiB]](Directory_LHCb-PAPER-2012-030/hidef_Figure1a.png)
![HiDef png [266 KiB]](Directory_LHCb-PAPER-2012-030/hidef_Figure1b.png)
![HiDef png [277 KiB]](Directory_LHCb-PAPER-2012-030/hidef_Figure1c.png)
![HiDef png [286 KiB]](Directory_LHCb-PAPER-2012-030/hidef_Figure1d.png)
![HiDef png [366 KiB]](Directory_LHCb-PAPER-2012-030/hidef_Figure2.png)
Tables and captions
|
Summary of the orbitally excited ($L=1$) $ B ^0_ s $ states. |
Table_1.pdf [54 KiB] HiDef png [50 KiB] Thumbnail [24 KiB] tex code |

|
|
Results of the fit to the mass difference distributions $m( B ^+ K ^- )-m( B ^+ )-m( K ^- )$. The first uncertainties are statistical and the second are systematic. |
Table_2.pdf [120 KiB] HiDef png [83 KiB] Thumbnail [39 KiB] tex code |

|
|
Absolute systematic uncertainties for each measurement, which are assumed to be independent and are added in quadrature. |
Table_3.pdf [76 KiB] HiDef png [63 KiB] Thumbnail [26 KiB] tex code |

|
![HiDef png [50 KiB]](Directory_LHCb-PAPER-2012-030/hidef_Table_1.png)
![HiDef png [83 KiB]](Directory_LHCb-PAPER-2012-030/hidef_Table_2.png)
![HiDef png [63 KiB]](Directory_LHCb-PAPER-2012-030/hidef_Table_3.png)
Created on 26 April 2024.