Information
LHCb-PAPER-2012-031
CERN-PH-EP-2012-334
arXiv:1208.3355 [PDF]
(Submitted on 16 Aug 2012)
Eur. Phys. J. C73 (2013) 2373
Inspire 1127719
Tools
Abstract
During 2011 the LHCb experiment at CERN collected $1.0 fb^{-1} $ of $\sqrt{s} = 7 \mathrm{ Te V} $ $pp$ collisions. Due to the large heavy quark production cross-sections, these data provide unprecedented samples of heavy flavoured hadrons. The first results from LHCb have made a significant impact on the flavour physics landscape and have definitively proved the concept of a dedicated experiment in the forward region at a hadron collider. This document discusses the implications of these first measurements on classes of extensions to the Standard Model, bearing in mind the interplay with the results of searches for on-shell production of new particles at ATLAS and CMS. The physics potential of an upgrade to the LHCb detector, which would allow an order of magnitude more data to be collected, is emphasised.
Figures and captions
|
Summary of recent measurements of the angular observables (a) $F_{L}$, (b) $A_{\rm FB}$, (c) $S_{3}$ and (d) $S_{9}$ in $ B ^0 \rightarrow K ^{*0} \mu ^+\mu ^- $ decays at LHCb, CDF and the $ B $ factories \cite{LHCb-CONF-2012-008}. Descriptions of these observables are provided in the text (see Eqs. (???), (???) and (???) and footnote ???). The theory predictions at low- and high-dimuon invariant masses are indicated by the coloured bands and are also described in detail in the text. |
BdKstmm_FL.pdf [19 KiB] HiDef png [183 KiB] Thumbnail [153 KiB] *.C file |

|
|
BdKstm[..].pdf [19 KiB] HiDef png [175 KiB] Thumbnail [151 KiB] *.C file |

|
|
|
BdKstmm_S3.pdf [18 KiB] HiDef png [121 KiB] Thumbnail [113 KiB] *.C file |

|
|
|
BdKstm[..].pdf [13 KiB] HiDef png [59 KiB] Thumbnail [35 KiB] *.C file |

|
|
|
Invariant mass of selected $ B ^+ \rightarrow \pi ^+ \mu ^+\mu ^- $ candidates in $1.0 fb^{-1} $ of integrated luminosity \cite{LHCb-PAPER-2012-020}. In the legend, "part. reco." and "combinatorial" refer to partially reconstructed and combinatorial backgrounds respectively. |
pimumu.pdf [22 KiB] HiDef png [266 KiB] Thumbnail [219 KiB] *.C file |

|
|
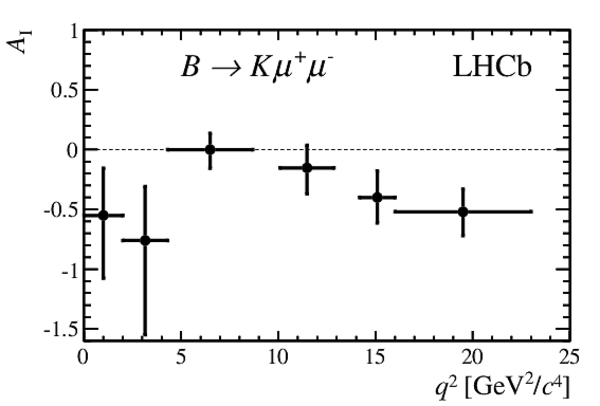
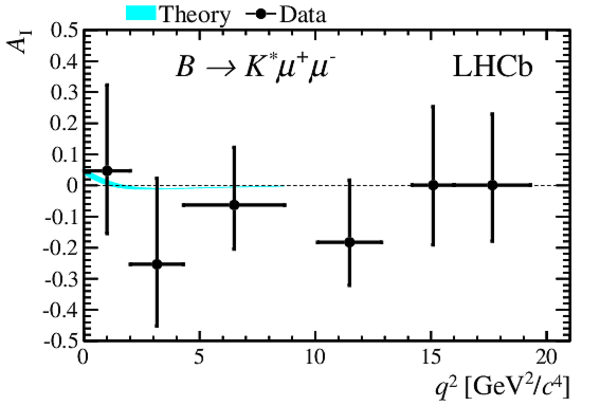
(a) $B \rightarrow K\mu ^+\mu ^- $ and (b) $B\rightarrow K^*\mu ^+\mu ^- $ isospin asymmetries in $1.0 fb^{-1} $ of data collected by the LHCb collaboration in 2011 \cite{LHCb-PAPER-2012-011}. |
isospin_K.pdf [14 KiB] HiDef png [68 KiB] Thumbnail [40 KiB] *.C file |
|
|
isospi[..].pdf [16 KiB] HiDef png [123 KiB] Thumbnail [126 KiB] *.C file |
|
|
|
Individual $2 \sigma$ constraints in the complex planes of Wilson coefficients, coming from $B\rightarrow X_s\ell^+\ell^-$ (brown), $B\rightarrow X_s\gamma$ (yellow), $A_{ C P }(b\rightarrow s\gamma)$ (orange), $B\rightarrow K^*\gamma$ (purple), $B\rightarrow K^*\mu^+\mu^-$ (green), $B\rightarrow K\mu^+\mu^-$ (blue) and $ B ^0_ s \rightarrow \mu^+\mu^-$ (grey), as well as combined 1 and $2 \sigma$ constraints (red) \cite{Altmannshofer:2012ir}. |
wccons[..].pdf [601 KiB] HiDef png [1 MiB] Thumbnail [637 KiB] *.C file |

|
|
Constraints from flavour observables in CMSSM in the plane ($m_{1/2}, m_0$) with $A_0=0$, for $\tan\beta$ = (left) 50 and (right) 30 \cite{Mahmoudi:2012uk}, using {\tt SuperIso} \cite{Mahmoudi:2007vz,Mahmoudi:2008tp}. The black line corresponds to the CMS exclusion limit with $1.1 fb^{-1} $ of data \cite{Chatrchyan:2011zy} and the red line to the CMS exclusion limit with $4.4 fb^{-1} $ of data \cite{CMS-PAS-SUS-12-005}. |
cmssm_[..].png [21 KiB] HiDef png [105 KiB] Thumbnail [54 KiB] *.C file |

|
|
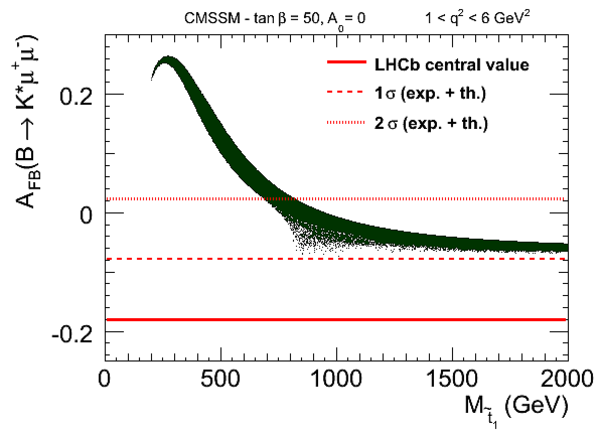
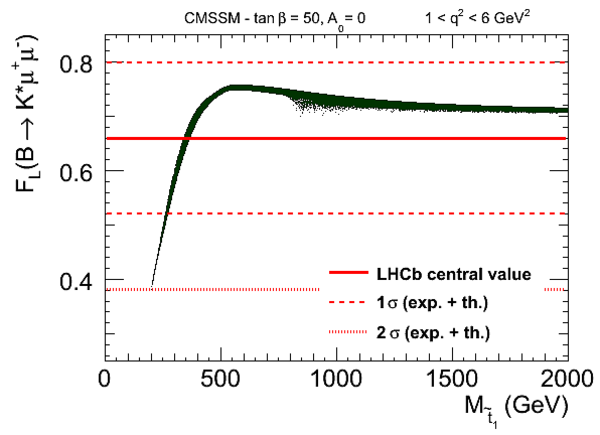
SUSY spread of (top left) $A_{\rm FB}(B\rightarrow K^*\mu^+\mu^-)$ at low $q^2$, (top right) $q^2_0(B\rightarrow K^*\mu^+\mu^-)$ and (bottom) $F_{\rm L}(B\rightarrow K^*\mu^+\mu^-)$ as a function of the lightest stop mass, for $A_0=0$ and $\tan\beta$ = 50 \cite{Mahmoudi:2012un}, using {\tt SuperIso} \cite{Mahmoudi:2007vz,Mahmoudi:2008tp}. The solid red lines correspond to the preliminary LHCb central value with $1.0 fb^{-1} $ \cite{LHCb-CONF-2012-008}, while the dashed and dotted lines represent the 1 and $2 \sigma$ bounds respectively, including both theoretical and experimental errors. |
tb50_A[..].png [10 KiB] HiDef png [155 KiB] Thumbnail [58 KiB] *.C file |
|
|
tb50_A[..].png [11 KiB] HiDef png [162 KiB] Thumbnail [60 KiB] *.C file |

|
|
|
tb50_A[..].png [10 KiB] HiDef png [139 KiB] Thumbnail [53 KiB] *.C file |
|
|
|
SUSY spread in NMFV-models \cite{Behring:2012mv}. The light (dark) grey shaded areas are the 95 % (68 %) confidence limit (C.L.) bounds from $B \rightarrow K^{(*)} l^+ l^-$ data \cite{Bobeth:2011nj}. The red dotted line denotes the $Z$-penguin correlation $C^{Z-\rm p}_{10}/C^{Z-\rm p}_9 =1/(4 \sin^2 \theta_W-1)$. The SM point $(C_9^{\rm SM},C_{10}^{\rm SM})$ is marked by the red dot. |
plot-m[..].pdf [152 KiB] HiDef png [310 KiB] Thumbnail [239 KiB] *.C file |

|
|
Impact of the latest $ B ^0_ s \rightarrow \mu^+\mu^-$ limits on the ($M_{A}$ , $\tan\beta$) plane in the (left) CMSSM and (right) NUHM1 \cite{Buchmueller:2012hv}. In each case, the full global fit is represented by an open green star and dashed blue and red lines for the 68 and 95 % C.L. contours, whilst the fits to the incomplete data sets are represented by closed stars and solid contours. |
cmssm_[..].pdf [29 KiB] HiDef png [297 KiB] Thumbnail [169 KiB] *.C file |

|
|
nuhm1_[..].pdf [34 KiB] HiDef png [394 KiB] Thumbnail [219 KiB] *.C file |

|
|
|
Distribution of pMSSM points after the $ B ^0_ s \rightarrow \mu^+ \mu^-$ constraint projected on the $M_A$ (left) and ($M_A , \tan \beta$) plane (right) for all accepted pMSSM points (medium grey), points not excluded by the combination of the 2010 LHCb and CMS analyses (dark grey) and the projection for the points compatible with the measurement of the SM expected branching fractions with a 20 % total uncertainty (light grey) \cite{Arbey:2011aa}. |
MABsmm.png [6 KiB] HiDef png [61 KiB] Thumbnail [25 KiB] *.C file |

|
|
MATbBsmm.png [19 KiB] HiDef png [128 KiB] Thumbnail [59 KiB] *.C file |

|
|
|
(Left) Preliminary LHCb measurement of $\phi_s$ and $\Delta\Gamma_s$ from $ B ^0_ s \rightarrow { J \mskip -3mu/\mskip -2mu\psi \mskip 2mu} \phi$ decays using $1.0 fb^{-1} $ \cite{LHCb-CONF-2012-002}. (Right) HFAG 2012 combination of $\phi_s$ and $\Delta\Gamma_s$ results, where the $1 \sigma$ confidence region is shown for each experiment and the combined result \cite{HFAG}. Note the different scales. |
phis_j[..].pdf [14 KiB] HiDef png [318 KiB] Thumbnail [172 KiB] *.C file |

|
|
hfag_f[..].pdf [181 KiB] HiDef png [196 KiB] Thumbnail [170 KiB] *.C file |

|
|
|
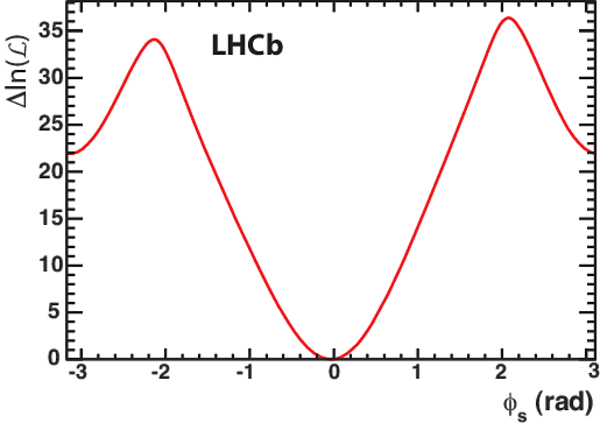
(Left) $\pi^+\pi^-$ mass distribution of selected $ B ^0_ s \rightarrow { J \mskip -3mu/\mskip -2mu\psi \mskip 2mu} \pi^+ \pi^-$ candidates and range used for the $\phi_s$ measurement. (Right) log-likelihood difference as a function $\phi_s$ \cite{LHCb-PAPER-2012-006}. |
pipimass.pdf [34 KiB] HiDef png [286 KiB] Thumbnail [167 KiB] *.C file |

|
|
phis_j[..].pdf [37 KiB] HiDef png [206 KiB] Thumbnail [158 KiB] *.C file |
|
|
|
Comparison of direct and indirect determinations of $\sin \phi_d \equiv \sin 2\beta$ {\it vs.} $\cal B (B^+ \rightarrow \tau^+ \nu)$, from Ref. \cite{Charles:2004jd}. |
tensio[..].pdf [117 KiB] HiDef png [232 KiB] Thumbnail [155 KiB] *.C file |

|
|
Model-independent fit \cite{Lenz:2012az} in the scenario that NP affects $M^q_{12}$ separately. The coloured areas represent regions with C.L. $< 68.3 \%$ for the individual constraints. The red area shows the region with C.L. $< 68.3 \%$ for the combined fit, with the two additional contours delimiting the regions with C.L. $< 95.45 \%$ and C.L. $< 99.73 \%$. |
NPmix_[..].pdf [66 KiB] HiDef png [343 KiB] Thumbnail [257 KiB] *.C file |

|
|
NPmix_[..].pdf [78 KiB] HiDef png [447 KiB] Thumbnail [295 KiB] *.C file |

|
|
|
Result of the UT fit within the SM: $\{\bar\rho, \bar\eta\}$ plane obtained by (left) UTfit \cite{Bona:2005vz} and (right) CKMfitter \cite{Charles:2004jd}. The 95 % probability regions selected by the single constraints are also shown with various colours for the different constraints. |
UTfit_[..].pdf [71 KiB] HiDef png [963 KiB] Thumbnail [405 KiB] *.C file |

|
|
CKMfit[..].pdf [78 KiB] HiDef png [694 KiB] Thumbnail [395 KiB] *.C file |

|
|
|
(Left) fit of the $K^+ \pi^- K^- \pi^+$ mass distribution for $ B ^0_ s \rightarrow K ^{*0} \overline{ K }{} ^{*0} $ candidates from $35 pb^{-1} $ \cite{LHCb-PAPER-2011-012}; (right) fit of the $K^+ K^- K^- K^+$ mass distribution for $ B ^0_ s \rightarrow \phi\phi$ candidates from $1.0 fb^{-1} $ \cite{LHCb-PAPER-2012-004}. |
kstarmass.pdf [19 KiB] HiDef png [256 KiB] Thumbnail [204 KiB] *.C file |

|
|
phiphi[..].pdf [11 KiB] HiDef png [168 KiB] Thumbnail [133 KiB] *.C file |

|
|
|
HFAG compilation of results for $ \sin 2\beta^{\rm eff}$ in $b \rightarrow s q \overline q $ decays \cite{HFAG}. |
sPengS[..].pdf [56 KiB] HiDef png [751 KiB] Thumbnail [511 KiB] *.C file |

|
|
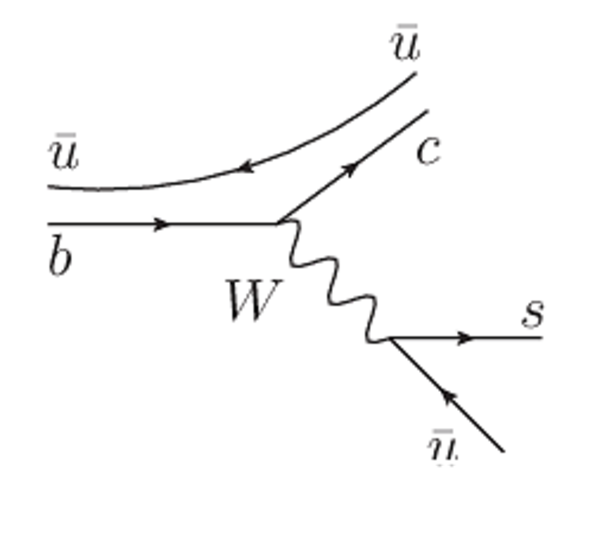
A $ B ^- \rightarrow D ^0 K ^- $ box diagram electroweak correction (left) with a different CKM structure than the leading weak decay amplitude (right). |
EWcorr[..].pdf [7 KiB] HiDef png [428 KiB] Thumbnail [246 KiB] *.C file |

|
|
bTocsubar.pdf [6 KiB] HiDef png [199 KiB] Thumbnail [111 KiB] *.C file |
|
|
|
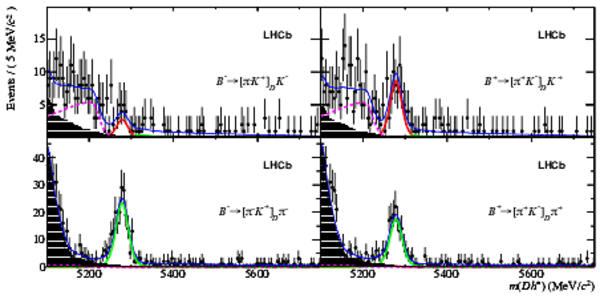
Invariant mass distributions of selected $ B ^\pm \rightarrow [\pi ^\pm K ^\pm ]_D h^\pm$ candidate events: (left) $ B ^- $ candidates, (right) $ B ^+ $ candidates \cite{LHCb-PAPER-2012-001}. In the top plots, the track directly from the $B$ vertex passes a kaon identification requirement and the $ B $ candidates are reconstructed assigning this track the kaon mass. The remaining events are placed in the bottom row and are reconstructed with a pion mass hypothesis. The dark (red) curve represents the $ B \rightarrow D K ^\pm $ events, the light (green) curve is $ B \rightarrow D\pi ^\pm $. The shaded contribution are partially reconstructed events and the thin line shows the total fit function which also includes a linear combinatoric component. The broken line represents the partially reconstructed $\overline{ B }{} ^0_ s \rightarrow D ^0 K ^+ \pi ^- $ decays where the pion is lost. |
gwt-1.pdf [197 KiB] HiDef png [365 KiB] Thumbnail [234 KiB] *.C file |
|
|
Mass distribution of the $ B^0_s \rightarrow D^\mp_s K^\pm$ candidate events \cite{LHCb-PAPER-2011-022}. The stacked background shapes follow the same top-to-bottom order in the legend and in the plot. |
DsK.pdf [26 KiB] HiDef png [213 KiB] Thumbnail [112 KiB] *.C file |

|
|
From left to right: PDF for $\gamma$ obtained using the GL method as described in the text; PDF for $\gamma$ obtained using the Fleischer method for $\kappa=0.1,0.5$ \cite{Ciuchini:2012gd}. Here and in the following, dark (light) areas correspond to $68 \%$ ($95 \%$) probability regions. |
su3_co[..].pdf [12 KiB] HiDef png [191 KiB] Thumbnail [103 KiB] *.C file |

|
|
su3_co[..].pdf [10 KiB] HiDef png [179 KiB] Thumbnail [98 KiB] *.C file |

|
|
|
su3_co[..].pdf [22 KiB] HiDef png [285 KiB] Thumbnail [157 KiB] *.C file |

|
|
|
From left to right: PDF for $\gamma$ obtained using the combined method for $\kappa = 0.1$, $0.5$; $68 \%$ probability region for $\gamma$ obtained using the combined method (filled area) or the GL method (horizontal lines) as a function of $\kappa$ \cite{Ciuchini:2012gd}. |
su3_co[..].pdf [10 KiB] HiDef png [180 KiB] Thumbnail [101 KiB] *.C file |

|
|
su3_co[..].pdf [11 KiB] HiDef png [195 KiB] Thumbnail [112 KiB] *.C file |

|
|
|
su3_co[..].pdf [6 KiB] HiDef png [100 KiB] Thumbnail [92 KiB] *.C file |

|
|
|
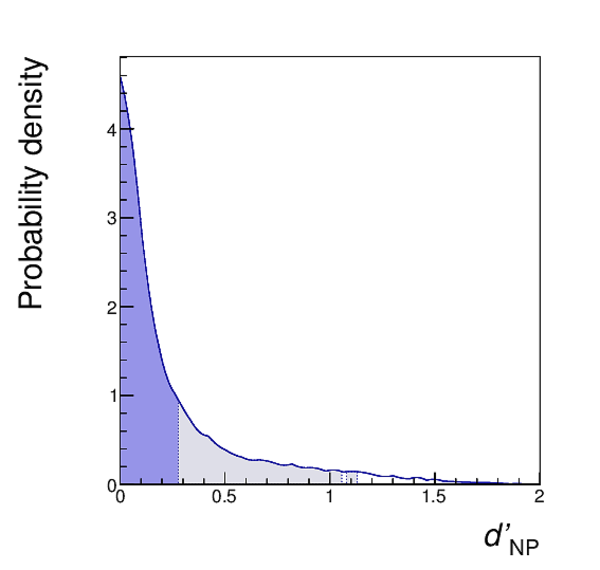
From left to right: PDFs for $\phi_\mathrm{NP}$, $d^\prime_\mathrm{NP}$ and $\theta^\prime_\mathrm{NP}$ obtained using the combined method with $\kappa = 0.5$ \cite{Ciuchini:2012gd}. |
su3_np[..].pdf [14 KiB] HiDef png [166 KiB] Thumbnail [109 KiB] *.C file |

|
|
su3_np[..].pdf [10 KiB] HiDef png [134 KiB] Thumbnail [87 KiB] *.C file |
|
|
|
su3_np[..].pdf [34 KiB] HiDef png [199 KiB] Thumbnail [128 KiB] *.C file |

|
|
|
Allowed region (shaded) in the $x_{12}^{\rm NP}/x_{12}-\sin\phi_{12}^{\rm NP}$ plane. The red line corresponds to a GMFV prediction (see text for details) with $r_{\rm GMFV} \in [-3,3]$. |
x12_phi12.png [18 KiB] HiDef png [116 KiB] Thumbnail [48 KiB] *.C file |

|
|
Bound on the squark mass degeneracy $\delta^{12}_{Q}$, defined in Eq. (???), as a function of the experimental constraint on $ C P$ violation in $ D ^0 $--$\overline{ D }{} ^0 $ mixing, parametrised by $\sin \phi_{12}^{\rm exp}$. The alignment angle from the down sector is $\lambda_{\rm C}^5$ (left panel) or $\lambda_{\rm C}^3$ (right panel). The solid blue line in each panel is for $\bar m_{\tilde Q}=m_{\tilde g}=1 \mathrm{ Te V} $ and the dashed red line is for $\bar m_{\tilde Q}=m_{\tilde g}=1.5 \mathrm{ Te V} $. |
susy_cpv5.png [10 KiB] HiDef png [63 KiB] Thumbnail [25 KiB] *.C file |

|
|
susy_cpv3.png [11 KiB] HiDef png [71 KiB] Thumbnail [28 KiB] *.C file |

|
|
|
Invariant mass distribution of selected $\Upsilon$ candidates from $25 pb^{-1} $ of data collected in 2010 \cite{LHCb-PAPER-2011-036}. The \Y1S, \Y2S and \Y3S states are clearly resolved. The results of a maximum likelihood fit are superimposed. |
upsmass.pdf [73 KiB] HiDef png [198 KiB] Thumbnail [172 KiB] *.C file |

|
|
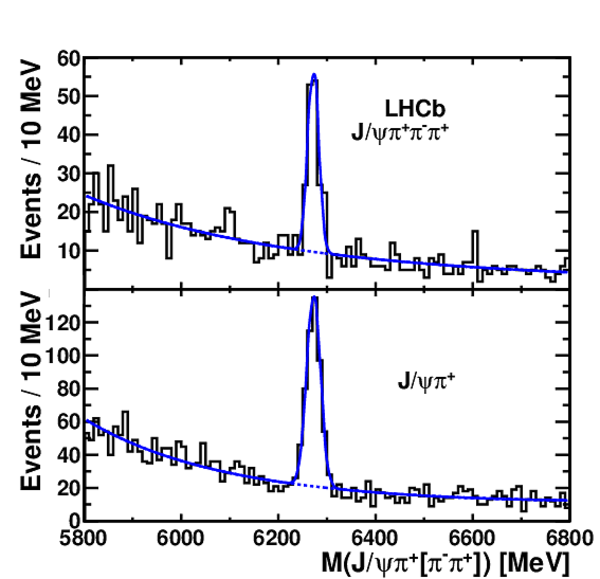
Invariant mass distribution of (top) $ B _ c ^+ \rightarrow { J \mskip -3mu/\mskip -2mu\psi \mskip 2mu} 3\pi^+$ and (bottom) $ B _ c ^+ \rightarrow { J \mskip -3mu/\mskip -2mu\psi \mskip 2mu} \pi^+$ candidates using $0.8 fb^{-1} $ of integrated luminosity collected in 2011 \cite{LHCb-PAPER-2011-044}. The results of maximum likelihood fits are superimposed. |
bcmass.pdf [18 KiB] HiDef png [261 KiB] Thumbnail [245 KiB] *.C file |
|
|
Invariant mass spectrum of $\Lambda _b^0 \pi^{+} \pi^{-}$ \cite{LHCb-PAPER-2012-012}. The points with error bars are the data, the solid line is the result of a fit to this distribution, and the dashed line is the fitted background contribution. |
lambda[..].pdf [29 KiB] HiDef png [225 KiB] Thumbnail [197 KiB] *.C file |

|
|
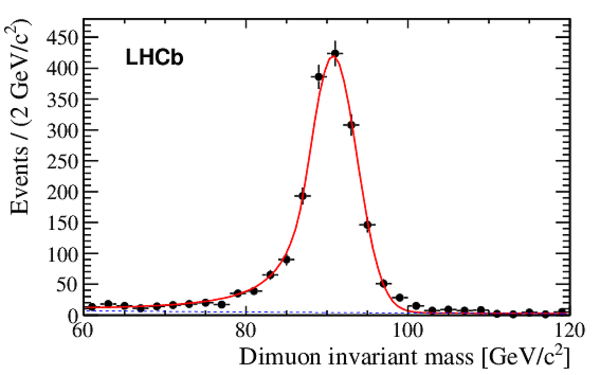
LHCb $Z$ and $W$ production results from $37 pb^{-1} $ at $\sqrt{s}=7 \mathrm{ Te V} $ \cite{LHCb-PAPER-2012-008}. Left: $Z \rightarrow \mu^+\mu^-$ peak. Right: $W^+ - W^-$ production asymmetry, where the bands correspond to the experimental uncertainties (only indicated within the LHCb acceptance), and the data points give predictions for various different parton density function sets. Note that the kinematic range of the ATLAS and CMS experiments only extends up to lepton pseudorapidities of 2.5. |
zpeak_[..].pdf [44 KiB] HiDef png [264 KiB] Thumbnail [149 KiB] *.C file |
|
|
Preliminary LHCb results on central exclusive $\chi_c$ production \cite{LHCb-CONF-2011-022}. The $ { J \mskip -3mu/\mskip -2mu\psi \mskip 2mu} \gamma$ invariant mass in data is compared to the expectation of the {\tt SuperCHIC} Monte Carlo generator \cite{SUPERCHIC}, which has been normalised to the observed number of events. The relative proportions of $\chi_{c0}$, $\chi_{c1}$ and $\chi_{c2}$ are 12 %, 36 % and 52 % respectively. |
chic.pdf [22 KiB] HiDef png [455 KiB] Thumbnail [337 KiB] *.C file |

|
|
Animated gif made out of all figures. |
PAPER-2012-031.gif Thumbnail |

|
![HiDef png [183 KiB]](Directory_LHCb-PAPER-2012-031/hidef_BdKstmm_FL.png)
![HiDef png [175 KiB]](Directory_LHCb-PAPER-2012-031/hidef_BdKstmm_AFB.png)
![HiDef png [121 KiB]](Directory_LHCb-PAPER-2012-031/hidef_BdKstmm_S3.png)
![HiDef png [59 KiB]](Directory_LHCb-PAPER-2012-031/hidef_BdKstmm_AIM.png)
![HiDef png [266 KiB]](Directory_LHCb-PAPER-2012-031/hidef_pimumu.png)
![HiDef png [68 KiB]](Directory_LHCb-PAPER-2012-031/hidef_isospin_K.png)
![HiDef png [123 KiB]](Directory_LHCb-PAPER-2012-031/hidef_isospin_Kstar.png)
![HiDef png [1 MiB]](Directory_LHCb-PAPER-2012-031/hidef_wcconstraints.png)
![cmssm_[..].png [21 KiB]](Directory_LHCb-PAPER-2012-031/cmssm_m0m12.png)
![HiDef png [105 KiB]](Directory_LHCb-PAPER-2012-031/hidef_cmssm_m0m12.png)
![tb50_A[..].png [10 KiB]](Directory_LHCb-PAPER-2012-031/tb50_A0_AFB_low_mt1.png)
![HiDef png [155 KiB]](Directory_LHCb-PAPER-2012-031/hidef_tb50_A0_AFB_low_mt1.png)
![tb50_A[..].png [11 KiB]](Directory_LHCb-PAPER-2012-031/tb50_A0_AFBzero_mt1.png)
![HiDef png [162 KiB]](Directory_LHCb-PAPER-2012-031/hidef_tb50_A0_AFBzero_mt1.png)
![tb50_A[..].png [10 KiB]](Directory_LHCb-PAPER-2012-031/tb50_A0_FL_lq2_mt1.png)
![HiDef png [139 KiB]](Directory_LHCb-PAPER-2012-031/hidef_tb50_A0_FL_lq2_mt1.png)
![HiDef png [310 KiB]](Directory_LHCb-PAPER-2012-031/hidef_plot-mia-delta23uLR-c7-sm.png)
![HiDef png [297 KiB]](Directory_LHCb-PAPER-2012-031/hidef_cmssm_mc8_drop_bsmm_MA_tanb_dchi_overlay.png)
![HiDef png [394 KiB]](Directory_LHCb-PAPER-2012-031/hidef_nuhm1_mc8_drop_bsmm_MA_tanb_dchi_overlay.png)
![MABsmm.png [6 KiB]](Directory_LHCb-PAPER-2012-031/MABsmm.png)
![HiDef png [61 KiB]](Directory_LHCb-PAPER-2012-031/hidef_MABsmm.png)
![MATbBsmm.png [19 KiB]](Directory_LHCb-PAPER-2012-031/MATbBsmm.png)
![HiDef png [128 KiB]](Directory_LHCb-PAPER-2012-031/hidef_MATbBsmm.png)
![HiDef png [318 KiB]](Directory_LHCb-PAPER-2012-031/hidef_phis_jpsiphi_new.png)
![HiDef png [196 KiB]](Directory_LHCb-PAPER-2012-031/hidef_hfag_fall2012_DGsphis_comb.png)
![HiDef png [286 KiB]](Directory_LHCb-PAPER-2012-031/hidef_pipimass.png)
![HiDef png [206 KiB]](Directory_LHCb-PAPER-2012-031/hidef_phis_jpsipipi.png)
![HiDef png [232 KiB]](Directory_LHCb-PAPER-2012-031/hidef_tension_sin2b_Btaunu.png)
![HiDef png [343 KiB]](Directory_LHCb-PAPER-2012-031/hidef_NPmix_ReImDeltas_3contours.png)
![HiDef png [447 KiB]](Directory_LHCb-PAPER-2012-031/hidef_NPmix_ReImDeltad_3contours.png)
![HiDef png [963 KiB]](Directory_LHCb-PAPER-2012-031/hidef_UTfit_fullfit.png)
![HiDef png [694 KiB]](Directory_LHCb-PAPER-2012-031/hidef_CKMfitter_fullfit.png)
![HiDef png [256 KiB]](Directory_LHCb-PAPER-2012-031/hidef_kstarmass.png)
![HiDef png [168 KiB]](Directory_LHCb-PAPER-2012-031/hidef_phiphi_1fb-1_UpDG.png)
![HiDef png [751 KiB]](Directory_LHCb-PAPER-2012-031/hidef_sPengS_CP_woKsPi0Pi0.png)
![HiDef png [428 KiB]](Directory_LHCb-PAPER-2012-031/hidef_EWcorr_bTocsubar.png)
![HiDef png [199 KiB]](Directory_LHCb-PAPER-2012-031/hidef_bTocsubar.png)
![HiDef png [365 KiB]](Directory_LHCb-PAPER-2012-031/hidef_gwt-1.png)
![HiDef png [213 KiB]](Directory_LHCb-PAPER-2012-031/hidef_DsK.png)
![HiDef png [191 KiB]](Directory_LHCb-PAPER-2012-031/hidef_su3_corr9_gammaGL.png)
![HiDef png [179 KiB]](Directory_LHCb-PAPER-2012-031/hidef_su3_corr1_gammaF.png)
![HiDef png [285 KiB]](Directory_LHCb-PAPER-2012-031/hidef_su3_corr5_gammaF.png)
![HiDef png [180 KiB]](Directory_LHCb-PAPER-2012-031/hidef_su3_corr1_gamma.png)
![HiDef png [195 KiB]](Directory_LHCb-PAPER-2012-031/hidef_su3_corr5_gamma.png)
![HiDef png [100 KiB]](Directory_LHCb-PAPER-2012-031/hidef_su3_corrgamma.png)
![HiDef png [166 KiB]](Directory_LHCb-PAPER-2012-031/hidef_su3_np5_phinp.png)
![HiDef png [134 KiB]](Directory_LHCb-PAPER-2012-031/hidef_su3_np5_dpnp.png)
![HiDef png [199 KiB]](Directory_LHCb-PAPER-2012-031/hidef_su3_np5_thetapnp.png)
![x12_phi12.png [18 KiB]](Directory_LHCb-PAPER-2012-031/x12_phi12.png)
![HiDef png [116 KiB]](Directory_LHCb-PAPER-2012-031/hidef_x12_phi12.png)
![susy_cpv5.png [10 KiB]](Directory_LHCb-PAPER-2012-031/susy_cpv5.png)
![HiDef png [63 KiB]](Directory_LHCb-PAPER-2012-031/hidef_susy_cpv5.png)
![susy_cpv3.png [11 KiB]](Directory_LHCb-PAPER-2012-031/susy_cpv3.png)
![HiDef png [71 KiB]](Directory_LHCb-PAPER-2012-031/hidef_susy_cpv3.png)
![HiDef png [198 KiB]](Directory_LHCb-PAPER-2012-031/hidef_upsmass.png)
![HiDef png [261 KiB]](Directory_LHCb-PAPER-2012-031/hidef_bcmass.png)
![HiDef png [225 KiB]](Directory_LHCb-PAPER-2012-031/hidef_lambdabstar.png)
![HiDef png [264 KiB]](Directory_LHCb-PAPER-2012-031/hidef_zpeak_lhcbstyle.png)
![HiDef png [455 KiB]](Directory_LHCb-PAPER-2012-031/hidef_chic.png)
Tables and captions
|
Status of $ B $ mixing measurements and corresponding SM predictions. New results presented at ICHEP 2012 and later are not included. The inclusive same-sign dimuon asymmetry $A^b_{\rm SL}$ is defined below and in Ref. \cite{Abazov:2011yk}. |
Table_1.pdf [69 KiB] HiDef png [110 KiB] Thumbnail [54 KiB] tex code |

|
|
Predictions for some parameters of the SM fit and their measurements as combined by the UTfit and CKMfitter groups. Note that the two groups use different input values for some parameters. The lines marked with (*) are not used in the full fit. Details of the pull calculation can be found in Refs. \cite{Bona:2009cj,Lenz:2010gu}. New results presented at ICHEP2012 and later are not included in these analyses. |
Table_2.pdf [60 KiB] HiDef png [89 KiB] Thumbnail [38 KiB] tex code |

|
|
LHCb measurements of $\phi_s$. The quoted uncertainties are statistical and systematic, respectively. |
Table_3.pdf [53 KiB] HiDef png [34 KiB] Thumbnail [15 KiB] tex code |

|
|
Current and projected precisions of the key observables in $b \rightarrow s q \overline q $ decays. |
Table_4.pdf [71 KiB] HiDef png [39 KiB] Thumbnail [17 KiB] tex code |

|
|
Ultimate NP scales that can be probed using different observables listed in the first column. They are given by saturating the theoretical errors given respectively by 1) $\delta \gamma/\gamma=10^{-6}$, 2) optimistically assuming no error on $f_B$, so that the ultimate theoretical error is only from electroweak corrections, 3) using SM predictions in Ref. \cite{Pirjol:2009vz}, 4) optimistically assuming perturbative error estimates $\delta \beta/\beta 0.1 \%$ \cite{Grossman:2002bu}, and 5) from bounds for $ {\rm Re} C_1 ( {\rm Im} C_1)$ from UTfitter \cite{Bona:2007vi}. |
Table_5.pdf [49 KiB] HiDef png [63 KiB] Thumbnail [30 KiB] tex code |

|
|
Experimental data on $B\rightarrow \pi\pi$ and $ B ^0_ s \rightarrow K ^+ K ^- $ decays. The correlation column refers to that between $S_f$ and $C_f$ measurements. Except for the preliminary results in Ref. \cite{LHCb-CONF-2012-007}, all other measurements have been averaged by HFAG \cite{HFAG}. The $ C P$ asymmetry of $B^+ \rightarrow \pi^+ \pi^0$ has been reported for completeness, although it has not been used in the analysis. New results on time-dependent $ C P$ violation in $ B ^0 \rightarrow \pi ^+ \pi ^- $ reported by Belle at CKM2012 \cite{Adachi:2013mae} are not included. |
Table_6.pdf [62 KiB] HiDef png [45 KiB] Thumbnail [23 KiB] tex code |

|
|
Estimated precision of $\gamma$ measurements with $50 fb^{-1} $ for various charmed $B$ decay modes. |
Table_7.pdf [60 KiB] HiDef png [74 KiB] Thumbnail [35 KiB] tex code |

|
|
Projected statistical uncertainties with 1.0 and $2.5 fb^{-1} $ of LHCb data. Yields are extrapolated based on samples used in analyses of 2011 data; sensitivities are projected from these yields assuming $1/\sqrt{N}$ scaling based on reported yields by LHCb, and using published input from BaBar , Belle , and CDF . The projected $ C P$ -violation sensitivities may vary depending on the true values of the mixing parameters. |
Table_8.pdf [63 KiB] HiDef png [76 KiB] Thumbnail [34 KiB] tex code |

|
|
Summary of absolute systematic uncertainties for $\Delta {\cal A}_{ C P } $ . |
Table_9.pdf [17 KiB] HiDef png [78 KiB] Thumbnail [33 KiB] tex code |

|
|
Numbers of $ D ^0$ and $ D ^{*+} \rightarrow D ^0 \pi ^+ $ signal events observed in the 2011 data in a variety of channels and those projected for $50 fb^{-1} $. These channels can be used for mixing studies, for indirect $ C P$ violation studies, and for direct $ C P$ violation studies. As discussed in the text, the numbers of events in any one channel can vary from one analysis to another, depending on the level of cleanliness required. Hence, all numbers should be understood to have an inherent variation of a factor of 2. To control systematic uncertainties with the very high level of precision that will be required by the upgrade, it may be necessary to sacrifice some of the statistics. |
Table_10.pdf [53 KiB] HiDef png [117 KiB] Thumbnail [58 KiB] tex code |

|
|
Numbers of $ D ^+$ and $ D ^+_ s $ signal events observed in the 2011 data in a variety of channels and those projected for $50 fb^{-1} $. These channels can be used for direct $ C P$ violation studies. As discussed in the text, the numbers of events in any one channel can vary from one analysis to another, depending on the level of cleanliness required. To control systematic uncertainties with the very high level of precision that will be required by the upgrade, it may be necessary to sacrifice some of the statistics. |
Table_11.pdf [59 KiB] HiDef png [118 KiB] Thumbnail [58 KiB] tex code |

|
|
Estimated statistical uncertainties for mixing and $ C P$ violation measurements which can be made with the projected samples for $50 fb^{-1} $ described in Table ???. |
Table_12.pdf [64 KiB] HiDef png [93 KiB] Thumbnail [44 KiB] tex code |

|
|
Estimated statistical uncertainties for $ C P$ violation measurements which can be made with the projected $ D ^+$ samples for $50 fb^{-1} $ described in Table ???. |
Table_13.pdf [53 KiB] HiDef png [115 KiB] Thumbnail [50 KiB] tex code |

|
|
Expected cross-sections in the LHCb acceptance and yields for double quarkonia production with $50 fb^{-1} $ at $\sqrt{s} = 14 \mathrm{ Te V} $. |
Table_14.pdf [38 KiB] HiDef png [75 KiB] Thumbnail [34 KiB] tex code |

|
|
Branching ratios and expected yields for selected $ B _ c ^+ $ decays to final states containing a $ { J \mskip -3mu/\mskip -2mu\psi \mskip 2mu} $ or $\psi {(2S)} $ meson. The branching ratios for the $ { J \mskip -3mu/\mskip -2mu\psi \mskip 2mu} $ modes are taken from Ref. \cite{lhcreport}, with the additional constraint of the ratio of the $ B _ c ^+ \rightarrow { J \mskip -3mu/\mskip -2mu\psi \mskip 2mu} 3\pi^+$ to $ B _ c ^+ \rightarrow { J \mskip -3mu/\mskip -2mu\psi \mskip 2mu} \pi^+$ reported in Ref. \cite{LHCb-PAPER-2011-044}. The $\psi(2S)$ mode branching ratios are estimated assuming that they are 0.5 of the $ { J \mskip -3mu/\mskip -2mu\psi \mskip 2mu} $ values, as observed in many modes (see for example Ref. \cite{LHCb-PAPER-2012-010}). Only dimuon modes are considered for the $ { J \mskip -3mu/\mskip -2mu\psi \mskip 2mu} $ and $\psi(2S)$, and only the $K^+K^{-}\pi^{+}$ ($K^+\pi^{-}\pi^{+}$) modes are considered for the $D^+_s$ ($D^+$) modes. The $ B _ c ^+ \rightarrow K^+ K^{*0}$ numbers are taken from Ref. \cite{Gao:2010zzc}. |
Table_15.pdf [55 KiB] HiDef png [83 KiB] Thumbnail [41 KiB] tex code |

|
|
Statistical sensitivities of the LHCb upgrade to key observables. For each observable the current sensitivity is compared to that which will be achieved by LHCb before the upgrade, and that which will be achieved with $50 fb^{-1} $ by the upgraded experiment. Systematic uncertainties are expected to be non-negligible for the most precisely measured quantities. Note that the current sensitivities do not include new results presented at ICHEP 2012 or CKM2012. |
Table_16.pdf [91 KiB] HiDef png [129 KiB] Thumbnail [53 KiB] tex code |

|
![HiDef png [110 KiB]](Directory_LHCb-PAPER-2012-031/hidef_Table_1.png)
![HiDef png [89 KiB]](Directory_LHCb-PAPER-2012-031/hidef_Table_2.png)
![HiDef png [34 KiB]](Directory_LHCb-PAPER-2012-031/hidef_Table_3.png)
![HiDef png [39 KiB]](Directory_LHCb-PAPER-2012-031/hidef_Table_4.png)
![HiDef png [63 KiB]](Directory_LHCb-PAPER-2012-031/hidef_Table_5.png)
![HiDef png [45 KiB]](Directory_LHCb-PAPER-2012-031/hidef_Table_6.png)
![HiDef png [74 KiB]](Directory_LHCb-PAPER-2012-031/hidef_Table_7.png)
![HiDef png [76 KiB]](Directory_LHCb-PAPER-2012-031/hidef_Table_8.png)
![HiDef png [78 KiB]](Directory_LHCb-PAPER-2012-031/hidef_Table_9.png)
![HiDef png [117 KiB]](Directory_LHCb-PAPER-2012-031/hidef_Table_10.png)
![HiDef png [118 KiB]](Directory_LHCb-PAPER-2012-031/hidef_Table_11.png)
![HiDef png [93 KiB]](Directory_LHCb-PAPER-2012-031/hidef_Table_12.png)
![HiDef png [115 KiB]](Directory_LHCb-PAPER-2012-031/hidef_Table_13.png)
![HiDef png [75 KiB]](Directory_LHCb-PAPER-2012-031/hidef_Table_14.png)
![HiDef png [83 KiB]](Directory_LHCb-PAPER-2012-031/hidef_Table_15.png)
![HiDef png [129 KiB]](Directory_LHCb-PAPER-2012-031/hidef_Table_16.png)
Created on 27 April 2024.