Measurement of the $B^0$--$\bar B^0$ oscillation frequency $\Delta m_d$ with the decays $B^0 \to D^- \pi^+$ and $B^0 \to J\ \psi K^{*0}$
[to restricted-access page]Information
LHCb-PAPER-2012-032
CERN-PH-EP-2012-315
arXiv:1210.6750 [PDF]
(Submitted on 25 Oct 2012)
Phys. Lett. B719 (2013) 318
Inspire 1193340
Tools
Abstract
The $B^0$--$\bar B^0$ oscillation frequency $\Delta m_d$ is measured by the LHCb experiment using a dataset corresponding to an integrated luminosity of $1.0 $fb$^{-1}$ of proton-proton collisions at $\sqrt{s} = 7 $TeV, and is found to be $\Delta m_d = 0.5156 \pm 0.0051 ($stat.$) \pm 0.0033 ($syst.$) $ps$^{-1}$. The measurement is based on results from analyses of the decays $B^0 \to D^- \pi^+$ ($D^- \to K^+ \pi^- \pi^-$) and $B^0 \to J/ \psi K^{*0}$ ($ J/ \psi \to \mu^+ \mu^-$, $K^{*0} \to K^+ \pi^-$) and their charge conjugated modes.
Figures and captions
|
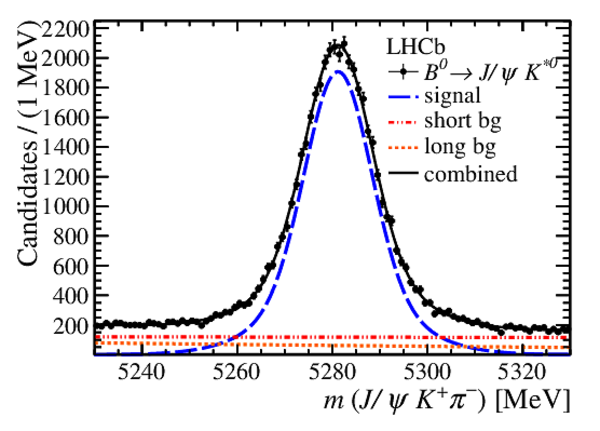
Distribution of the $ B ^0$ candidate mass (black points). (Left) $ B ^0 \rightarrow D ^- \pi ^+ $ candidates with the invariant mass pdf as described in Sect. 6 and two additional components for the physics background taken from MC simulated events.The blue dashed line shows the fit projection of the signal, the dotted orange line corresponds to the combinatorial background, the filled areas represent the physics background, and the black solid line corresponds to the fit projection. (Right) $ B ^0 \rightarrow { J \mskip -3mu/\mskip -2mu\psi \mskip 2mu} K ^{*0} $ candidates, with the results of the fits described in Sect. 6 superimposed. The blue dashed line shows the fit projection of the signal, the dotted orange line corresponds to the combinatorial background with long lifetime and the dash dotted red line shows the combinatorial background with short lifetime. The black solid line corresponds to the fit projection. |
DpiMass.pdf [39 KiB] HiDef png [268 KiB] Thumbnail [224 KiB] *.C file |

|
|
KstMass.pdf [27 KiB] HiDef png [279 KiB] Thumbnail [262 KiB] *.C file |
|
|
|
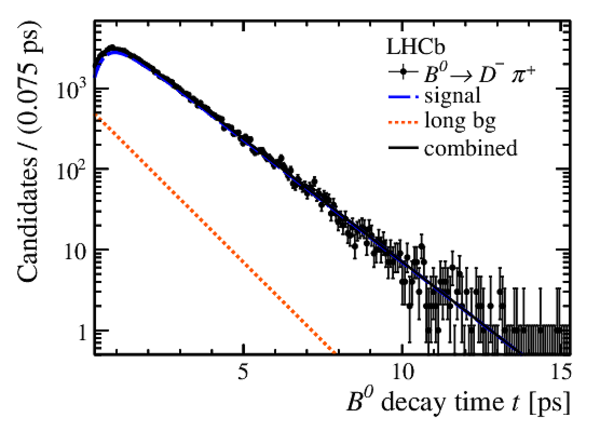
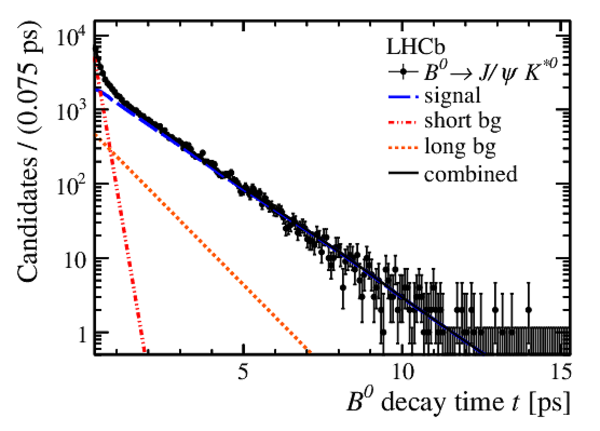
Distribution of the decay time (black points) for (left) $ B ^0 \rightarrow D ^- \pi ^+ $ and (right) $ B ^0 \rightarrow { J \mskip -3mu/\mskip -2mu\psi \mskip 2mu} K ^{*0} $ candidates. The blue dashed line shows the fit projection of the signal, the dotted orange line corresponds to the combinatorial background with long lifetime and the dash dotted red line shows the combinatorial background with short lifetime (only in the $ B ^0 \rightarrow { J \mskip -3mu/\mskip -2mu\psi \mskip 2mu} K ^{*0} $ mode). The black solid line corresponds to the projection of the combined PDF. |
DpiTime.pdf [33 KiB] HiDef png [206 KiB] Thumbnail [198 KiB] *.C file |
|
|
KstTime.pdf [31 KiB] HiDef png [229 KiB] Thumbnail [218 KiB] *.C file |
|
|
|
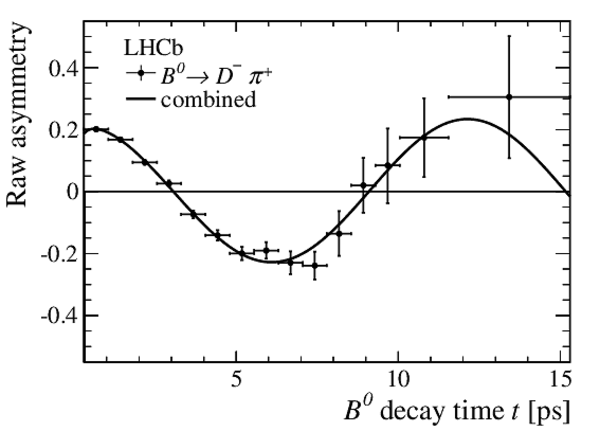
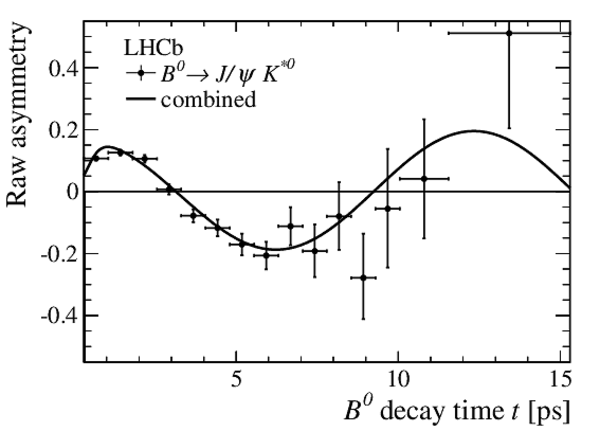
Raw mixing asymmetry $\mathcal{A}_\mathrm{mix}$ (black points) for (left) $ B ^0 \rightarrow D ^- \pi ^+ $ and (right) $ B ^0 \rightarrow { J \mskip -3mu/\mskip -2mu\psi \mskip 2mu} K ^{*0} $ candidates. The solid black line is the projection of the mixing asymmetry of the combined PDF. |
DpiAsym.pdf [16 KiB] HiDef png [96 KiB] Thumbnail [54 KiB] *.C file |
|
|
KstAsym.pdf [15 KiB] HiDef png [99 KiB] Thumbnail [56 KiB] *.C file |
|
|
|
Animated gif made out of all figures. |
PAPER-2012-032.gif Thumbnail |

|
![HiDef png [268 KiB]](Directory_LHCb-PAPER-2012-032/hidef_DpiMass.png)
![HiDef png [279 KiB]](Directory_LHCb-PAPER-2012-032/hidef_KstMass.png)
![HiDef png [206 KiB]](Directory_LHCb-PAPER-2012-032/hidef_DpiTime.png)
![HiDef png [229 KiB]](Directory_LHCb-PAPER-2012-032/hidef_KstTime.png)
![HiDef png [96 KiB]](Directory_LHCb-PAPER-2012-032/hidef_DpiAsym.png)
![HiDef png [99 KiB]](Directory_LHCb-PAPER-2012-032/hidef_KstAsym.png)
Tables and captions
|
Systematic uncertainties on $\Delta m_d$ in $\text{ps}^{-1}$ |
Table_1.pdf [45 KiB] HiDef png [65 KiB] Thumbnail [30 KiB] tex code |

|
![HiDef png [65 KiB]](Directory_LHCb-PAPER-2012-032/hidef_Table_1.png)
Created on 27 April 2024.