First observation of the decays $\bar{B}^0_{(s)}\to D_s^+K^-\pi^+\pi^-$ and $\bar{B}^0_s\to D_{s1}(2536)^+\pi^-$
[to restricted-access page]Information
LHCb-PAPER-2012-033
CERN-PH-EP-2012-327
arXiv:1211.1541 [PDF]
(Submitted on 07 Nov 2012)
Phys. Rev. D86 (2012) 112005
Inspire 1199002
Tools
Abstract
The first observation of the decays $\bar{B}^0_{s}\to D_s^+K^-\pi^+\pi^-$ and $\bar{B}^0\to D_s^+K^-\pi^+\pi^-$ are reported using an integrated luminosity of 1.0 fb$^{-1}$ recorded by the LHCb experiment. The branching fractions, normalized with respect to $\bar{B}^0_{s}\to D_s^+\pi^-\pi^+\pi^-$ and $\bar{B}^0_{s}\to D_s^+K^-\pi^+\pi^-$, respectively, are measured to be {\br(\bar{B}^0_{s}\to D_s^+K^-\pi^+\pi^-)\over\br(\bar{B}^0_{s}\to D_s^+\pi^-\pi^+\pi^-)} &= (5.2\pm0.5\pm0.3)\times10^{-2}, {\br(\bar{B}^0\to D_s^+K^-\pi^+\pi^-)\over\br(\bar{B}^0_{s}\to D_s^+K^-^\pi^+\pi^-)} &= 0.54\pm0.07\pm0.07, where the first uncertainty is statistical and the second is systematic. The $\bar{B}^0_{s}\to D_s^+K^-\pi^+\pi^-$ decay is of particular interest as it can be used to measure the weak phase $\gamma$. First observation of the $\bar{B}^0_s\to D_{s1}(2536)^+\pi^-, D_{s1}^+\to D_s^+\pi^-\pi^+$ decay is also presented, and its branching fraction relative to $\bar{B}^0_{s}\to D_s^+\pi^-\pi^+\pi^-$ is found to be {\br(\bar{B}^0_s\to D_{s1}(2536)^+\pi^-, D_{s1}^+\to D_s^+\pi^-\pi^+)\over\br(\bar{B}^0_{s}\to D_s^+\pi^-\pi^+\pi^-)} &= (4.0\pm1.0\pm0.4)\times10^{-3}.
Figures and captions
|
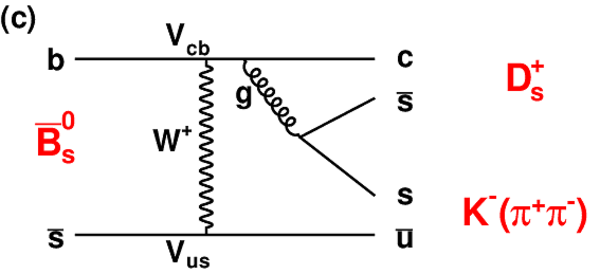
Diagrams contributing to the $ B ^0_ s ,\overline{ B }{} ^0_ s \rightarrow D ^+_ s K^-\pi^+\pi^-$ (a-c) and $\overline{ B }{} ^0 \rightarrow D ^+_ s K^-\pi^+\pi^-$ (d-f) decays, as described in the text. In (a-d), the additional ($\pi ^+ \pi ^- $) indicates that the $ K ^- \pi ^+ \pi ^- $ may be produced either through an excited strange kaon resonance decay, or through fragmentation. |
TreeBs[..].eps [7 KiB] HiDef png [65 KiB] Thumbnail [54 KiB] *.C file |

|
|
TreeBs[..].eps [7 KiB] HiDef png [64 KiB] Thumbnail [54 KiB] *.C file |

|
|
|
Exchan[..].eps [10 KiB] HiDef png [84 KiB] Thumbnail [76 KiB] *.C file |
|
|
|
Exchan[..].eps [10 KiB] HiDef png [82 KiB] Thumbnail [74 KiB] *.C file |

|
|
|
Exchan[..].eps [8 KiB] HiDef png [75 KiB] Thumbnail [70 KiB] *.C file |

|
|
|
Exchan[..].eps [9 KiB] HiDef png [78 KiB] Thumbnail [74 KiB] *.C file |

|
|
|
Invariant mass distribution for $\overline{ B }{} ^0_ s \rightarrow D ^+_ s \pi^-\pi^+\pi^-$ candidates. The fitted signal probability disrtibution function (PDF) is indicated by the dashed line and the background shapes are shown as shaded regions, as described in the text. |
MassPl[..].eps [25 KiB] HiDef png [171 KiB] Thumbnail [92 KiB] *.C file |

|
|
Invariant mass distribution for $\overline{ B }{} ^0 _{(s)}\rightarrow D ^+_ s K ^- \pi ^+ \pi ^- $ candidates. The fitted signal (dashed lines) and background shapes (shaded/hatched regions) are shown, as described in the text. |
MassPl[..].eps [41 KiB] HiDef png [322 KiB] Thumbnail [152 KiB] *.C file |

|
|
Invariant mass distributions for (a) $X_d$, (b) smaller $\pi ^+ \pi ^- $ mass in $X_d$ and (c) the larger $\pi ^+ \pi ^- $ mass in $X_d$, from $\overline{ B }{} ^0_ s \rightarrow D ^+_ s \pi^-\pi^+\pi^-$ decays using sWeights. The points are the data and the solid line is the simulation. The simulated distribution is normalized to have the same yield as the data. |
Bs2Ds3[..].eps [16 KiB] HiDef png [152 KiB] Thumbnail [131 KiB] *.C file |

|
|
Invariant mass distributions for (a) $X_s$, (b) $\pi ^+ \pi ^- $ in $X_s$ and (c) the $ K ^- \pi ^+ $ in $X_s$, from $\overline{ B }{} ^0_ s \rightarrow D ^+_ s K^-\pi^+\pi^-$ data using sWeights. The points are data and the solid line is the simulation. The simulated distribution is normalized to have the same yield as the data. |
Bs2DsK[..].eps [16 KiB] HiDef png [145 KiB] Thumbnail [124 KiB] *.C file |

|
|
Invariant mass distributions for (a) $X_s$, (b) $\pi ^+ \pi ^- $ in $X_s$ and (c) the $ K ^- \pi ^+ $ in $X_s$, from $\overline{ B }{} ^0 \rightarrow D ^+_ s K^-\pi^+\pi^-$ data using sWeights. The points are data and the solid line is the simulation. The simulated distribution is normalized to have the same yield as the data. |
Bd2DsK[..].eps [17 KiB] HiDef png [150 KiB] Thumbnail [133 KiB] *.C file |

|
|
Distribution of the difference in invariant mass, $M( D ^+_ s \pi ^- \pi ^+ )-M( D ^+_ s )$, using $\overline{ B }{} ^0_ s \rightarrow D ^+_ s \pi^-\pi^+\pi^-$ candidates within 40 $ {\mathrm{ Me V /}c^2}$ of the known $ B ^0_ s $ mass (points) and in the upper $ B ^0_ s $ mass sidebands (filled histogram). The fit to the distribution is shown, as described in the text. |
Bs2Ds1Pi.eps [31 KiB] HiDef png [204 KiB] Thumbnail [93 KiB] *.C file |

|
|
Animated gif made out of all figures. |
PAPER-2012-033.gif Thumbnail |

|
![HiDef png [65 KiB]](Directory_LHCb-PAPER-2012-033/hidef_TreeBs2DsKDecayCF.png)
![HiDef png [64 KiB]](Directory_LHCb-PAPER-2012-033/hidef_TreeBs2DsKDecayCS.png)
![HiDef png [84 KiB]](Directory_LHCb-PAPER-2012-033/hidef_ExchangeBs2DsKCF.png)
![HiDef png [82 KiB]](Directory_LHCb-PAPER-2012-033/hidef_ExchangeB02DsKCF.png)
![HiDef png [75 KiB]](Directory_LHCb-PAPER-2012-033/hidef_ExchangeB02DsKCF1.png)
![HiDef png [78 KiB]](Directory_LHCb-PAPER-2012-033/hidef_ExchangeB02DsKCF2.png)
![HiDef png [171 KiB]](Directory_LHCb-PAPER-2012-033/hidef_MassPlot_B2DsPiPiPi.png)
![HiDef png [322 KiB]](Directory_LHCb-PAPER-2012-033/hidef_MassPlot_B2DsKPiPi.png)
![HiDef png [152 KiB]](Directory_LHCb-PAPER-2012-033/hidef_Bs2Ds3Pi_Masses.png)
![HiDef png [145 KiB]](Directory_LHCb-PAPER-2012-033/hidef_Bs2DsKPiPi_Masses.png)
![HiDef png [150 KiB]](Directory_LHCb-PAPER-2012-033/hidef_Bd2DsKPiPi_Masses.png)
![HiDef png [204 KiB]](Directory_LHCb-PAPER-2012-033/hidef_Bs2Ds1Pi.png)
Tables and captions
|
Summary of event yields from data in the $ D ^+_ s $ signal and sidebands regions, and the background corrected yield. The signal and sideband regions require $ D ^+_ s $ candidates to have invariant mass $|M( K ^+ K ^- \pi ^+ )-m_{ D ^+_ s }|<20$ $ {\mathrm{ Me V /}c^2}$ and $35<|M( K ^+ K ^- \pi ^+ )-m_{ D ^+_ s }|<55$ $ {\mathrm{ Me V /}c^2}$ , respectively, where $m_{ D ^+_ s }$ is the $ D ^+_ s $ mass [26]. |
Table_1.pdf [52 KiB] HiDef png [38 KiB] Thumbnail [18 KiB] tex code |

|
|
Selection efficiencies and correction factors for decay modes under study. The uncertainties on the selection efficiencies are statistical only, whereas the correction factors show the total uncertainty. |
Table_2.pdf [53 KiB] HiDef png [35 KiB] Thumbnail [17 KiB] tex code |

|
|
Summary of systematic uncertainties (in %) on the measurements of the ratios of branching fractions. |
Table_3.pdf [63 KiB] HiDef png [59 KiB] Thumbnail [28 KiB] tex code |

|
![HiDef png [38 KiB]](Directory_LHCb-PAPER-2012-033/hidef_Table_1.png)
![HiDef png [35 KiB]](Directory_LHCb-PAPER-2012-033/hidef_Table_2.png)
![HiDef png [59 KiB]](Directory_LHCb-PAPER-2012-033/hidef_Table_3.png)
Created on 03 May 2024.