Measurement of the forward energy flow in $pp$ collisions at $\sqrt{s}$= 7 TeV
[to restricted-access page]Information
LHCb-PAPER-2012-034
CERN-PH-EP-2012-346
arXiv:1212.4755 [PDF]
(Submitted on 19 Dec 2012)
Eur. Phys. J. C73 (2013) 2421
Inspire 1208105
Tools
Abstract
The energy flow created in pp collisions at sqrt(s)=7 TeV is studied within the pseudorapidity range 1.9<eta<4.9 with data collected by the LHCb experiment. The measurements are performed for inclusive minimum-bias interactions, hard scattering processes and events with an enhanced or suppressed diffractive contribution. The results are compared to predictions given by PYTHIA-based and cosmic-ray event generators, which provide different models of soft hadronic interactions.
Figures and captions
|
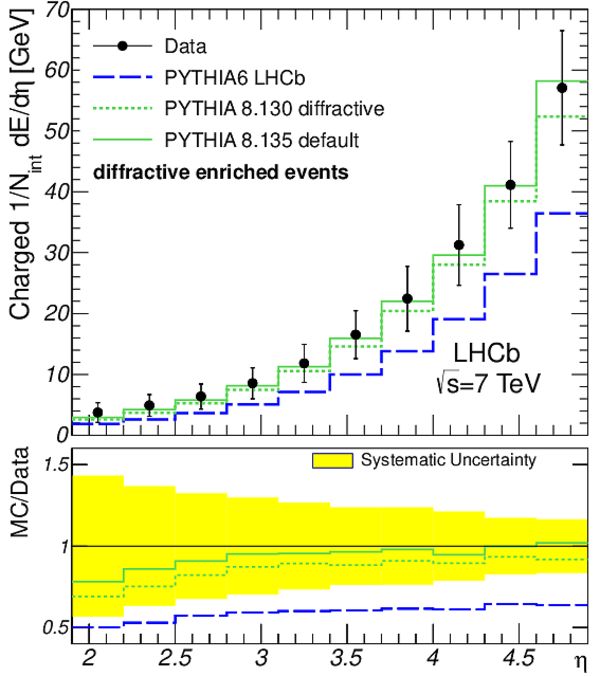
Charged energy flow as a function of $\eta$ for all event classes as indicated in the figures. The corrected measurements are given by points with error bars, while the predictions by the {\sc Pythia} tunes are shown as histograms. The error bars represent the systematic uncertainties, which are highly correlated between the bins. The statistical uncertainties are negligible. The ratios of MC predictions to data are shown in addition. |
Inclus[..].pdf [16 KiB] HiDef png [327 KiB] Thumbnail [292 KiB] *.C file |

|
|
HardQC[..].pdf [16 KiB] HiDef png [323 KiB] Thumbnail [294 KiB] *.C file |

|
|
|
DiffrC[..].pdf [16 KiB] HiDef png [303 KiB] Thumbnail [275 KiB] *.C file |
|
|
|
NonDif[..].pdf [16 KiB] HiDef png [335 KiB] Thumbnail [295 KiB] *.C file |

|
|
|
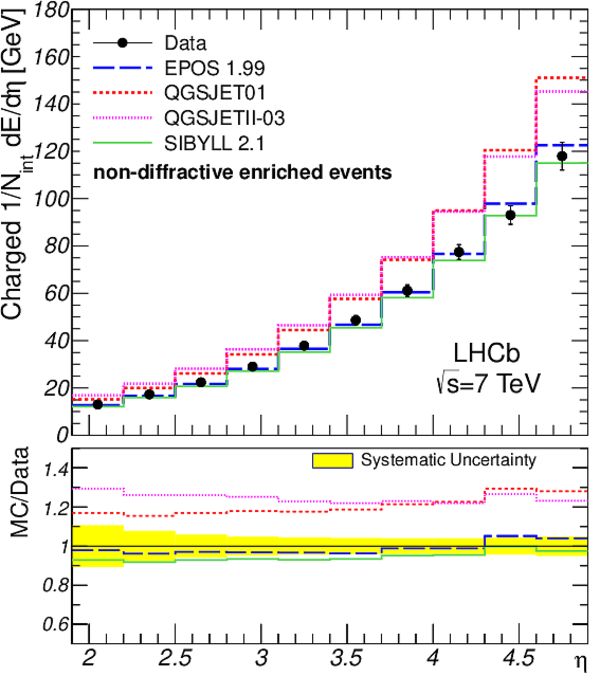
Charged energy flow as a function of $\eta$ for all event classes as indicated in the figures. The corrected measurements are given by points with error bars, while the predictions by the cosmic-ray interaction models are shown as histograms. The error bars represent the systematic uncertainties, which are highly correlated between the bins. The statistical uncertainties are negligible. The ratios of MC predictions to data are shown in addition. |
Inclus[..].pdf [16 KiB] HiDef png [315 KiB] Thumbnail [283 KiB] *.C file |

|
|
HardQC[..].pdf [16 KiB] HiDef png [325 KiB] Thumbnail [286 KiB] *.C file |

|
|
|
DiffrC[..].pdf [16 KiB] HiDef png [315 KiB] Thumbnail [276 KiB] *.C file |

|
|
|
NonDif[..].pdf [16 KiB] HiDef png [321 KiB] Thumbnail [291 KiB] *.C file |
|
|
|
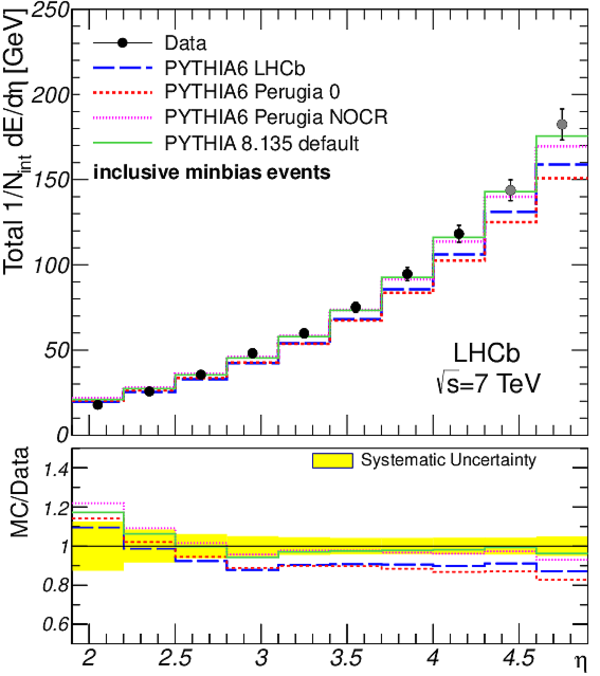
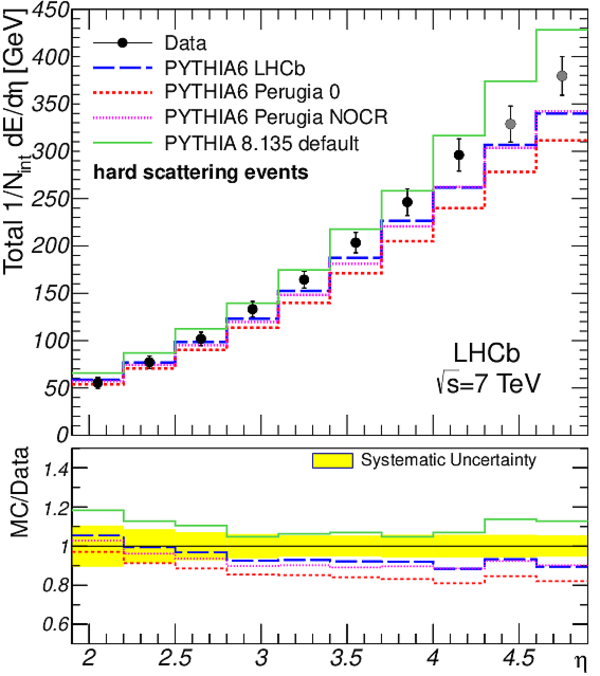
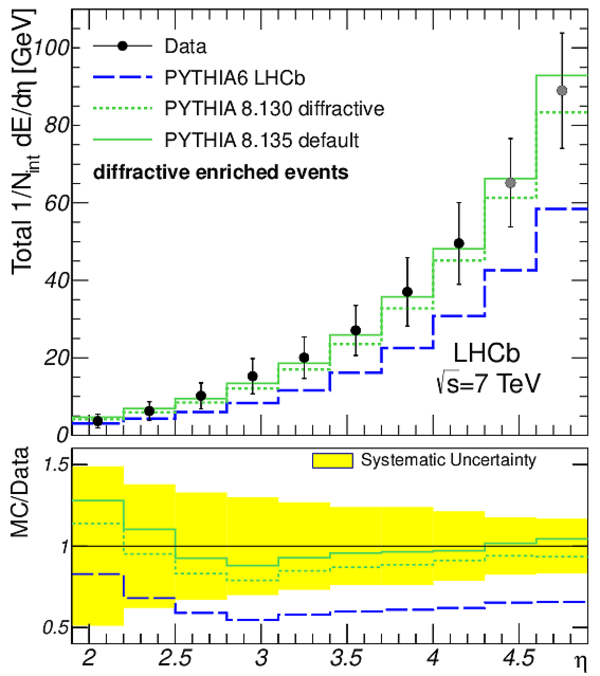
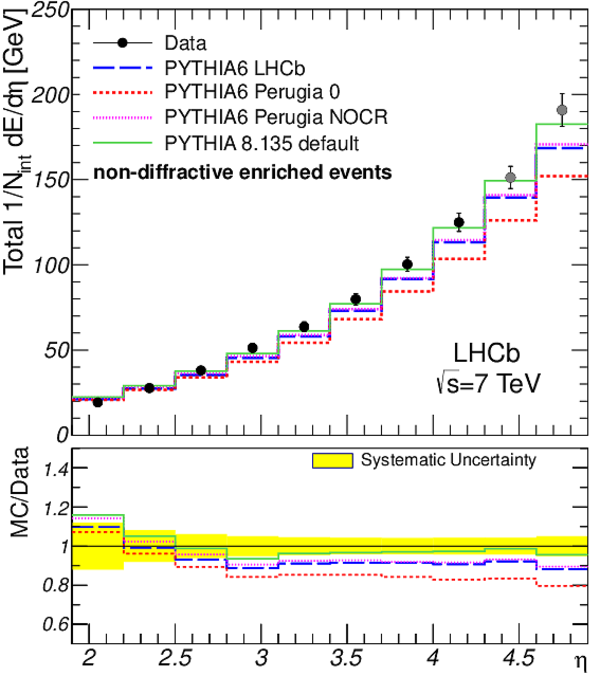
Total energy flow as a function of $\eta$ for all event classes as indicated in the figures. The corrected measurements are given by points with error bars, while the predictions by the {\sc Pythia} tunes are shown as histograms. The data obtained with extrapolated $k_{\eta}$ factors are shown in grey. The error bars represent the systematic uncertainties, which are highly correlated between the bins. The statistical uncertainties are negligible. The ratios of MC predictions to data are shown in addition. |
Inclus[..].pdf [16 KiB] HiDef png [322 KiB] Thumbnail [284 KiB] *.C file |
|
|
HardQC[..].pdf [16 KiB] HiDef png [340 KiB] Thumbnail [311 KiB] *.C file |
|
|
|
DiffrT[..].pdf [16 KiB] HiDef png [294 KiB] Thumbnail [262 KiB] *.C file |
|
|
|
NonDif[..].pdf [16 KiB] HiDef png [324 KiB] Thumbnail [285 KiB] *.C file |
|
|
|
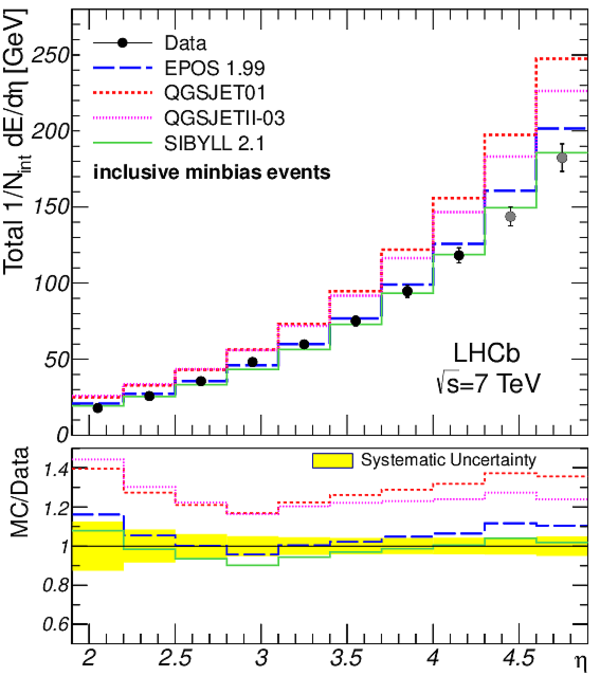
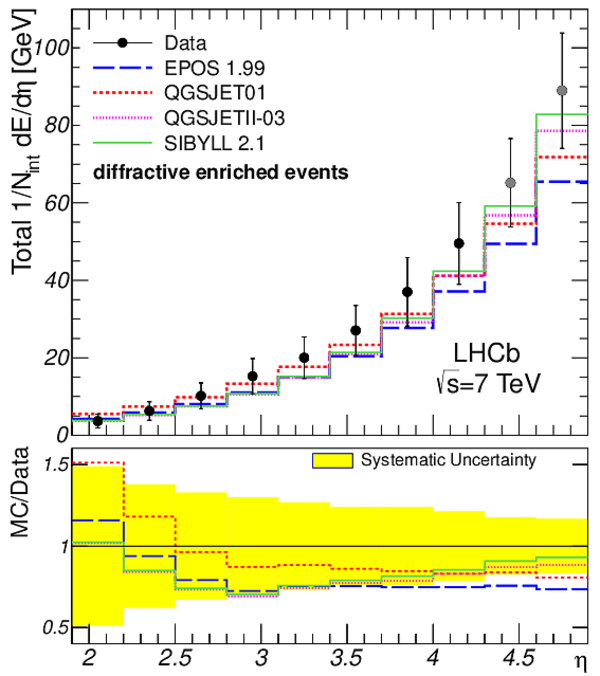
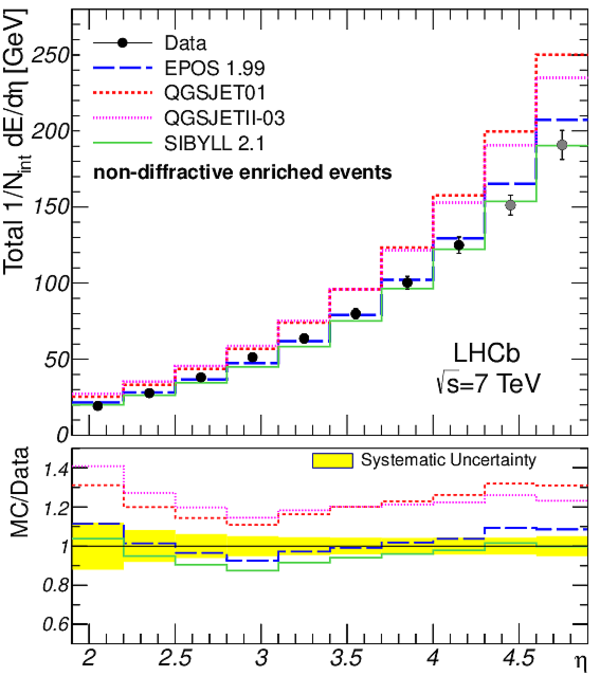
Total energy flow as a function of $\eta$ for all event classes as indicated in the figures. The corrected measurements are given by points with error bars, while the predictions by the cosmic-ray interaction models are shown as histograms. The data obtained with extrapolated $k_{\eta}$ factors are shown in grey. The error bars represent the systematic uncertainties, which are highly correlated between the bins. The statistical uncertainties are negligible. The ratios of MC predictions to data are shown in addition. |
Inclus[..].pdf [16 KiB] HiDef png [308 KiB] Thumbnail [271 KiB] *.C file |
|
|
HardQC[..].pdf [16 KiB] HiDef png [314 KiB] Thumbnail [273 KiB] *.C file |

|
|
|
DiffrT[..].pdf [16 KiB] HiDef png [308 KiB] Thumbnail [262 KiB] *.C file |
|
|
|
NonDif[..].pdf [16 KiB] HiDef png [309 KiB] Thumbnail [273 KiB] *.C file |
|
|
|
Animated gif made out of all figures. |
PAPER-2012-034.gif Thumbnail |

|
![HiDef png [327 KiB]](Directory_LHCb-PAPER-2012-034/hidef_InclusiveChargedEF_pythia.png)
![HiDef png [323 KiB]](Directory_LHCb-PAPER-2012-034/hidef_HardQCDChargedEF_pythia.png)
![HiDef png [303 KiB]](Directory_LHCb-PAPER-2012-034/hidef_DiffrChargedEF_pythia.png)
![HiDef png [335 KiB]](Directory_LHCb-PAPER-2012-034/hidef_NonDiffrChargedEF_pythia.png)
![HiDef png [315 KiB]](Directory_LHCb-PAPER-2012-034/hidef_InclusiveChargedEF_cosmic.png)
![HiDef png [325 KiB]](Directory_LHCb-PAPER-2012-034/hidef_HardQCDChargedEF_cosmic.png)
![HiDef png [315 KiB]](Directory_LHCb-PAPER-2012-034/hidef_DiffrChargedEF_cosmic.png)
![HiDef png [321 KiB]](Directory_LHCb-PAPER-2012-034/hidef_NonDiffrChargedEF_cosmic.png)
![HiDef png [322 KiB]](Directory_LHCb-PAPER-2012-034/hidef_InclusiveTotalEF_pythia.png)
![HiDef png [340 KiB]](Directory_LHCb-PAPER-2012-034/hidef_HardQCDTotalEF_pythia.png)
![HiDef png [294 KiB]](Directory_LHCb-PAPER-2012-034/hidef_DiffrTotalEF_pythia.png)
![HiDef png [324 KiB]](Directory_LHCb-PAPER-2012-034/hidef_NonDiffrTotalEF_pythia.png)
![HiDef png [308 KiB]](Directory_LHCb-PAPER-2012-034/hidef_InclusiveTotalEF_cosmic.png)
![HiDef png [314 KiB]](Directory_LHCb-PAPER-2012-034/hidef_HardQCDTotalEF_cosmic.png)
![HiDef png [308 KiB]](Directory_LHCb-PAPER-2012-034/hidef_DiffrTotalEF_cosmic.png)
![HiDef png [309 KiB]](Directory_LHCb-PAPER-2012-034/hidef_NonDiffrTotalEF_cosmic.png)
Tables and captions
|
Relative systematic uncertainties (in percent) affecting the energy flow measurements for all event classes. The total uncertainties are obtained by adding the individual sources in quadrature. The ranges indicate the variation of the uncertainty as a function of $\eta$. |
Table_1.pdf [52 KiB] HiDef png [119 KiB] Thumbnail [57 KiB] tex code |

|
|
Charged energy flow for all event classes and $\eta$ bins with the corresponding systematic uncertainties. The statistical uncertainties are insignificant and not listed. All values are in GeV per unit pseudorapidity interval. |
Table_2.pdf [32 KiB] HiDef png [97 KiB] Thumbnail [49 KiB] tex code |

|
|
Total energy flow for all event classes and $\eta$ bins with the corresponding systematic uncertainties. The statistical uncertainties are insignificant and not listed. All values are in GeV per unit pseudorapidity interval. |
Table_3.pdf [32 KiB] HiDef png [103 KiB] Thumbnail [52 KiB] tex code |

|
![HiDef png [119 KiB]](Directory_LHCb-PAPER-2012-034/hidef_Table_1.png)
![HiDef png [97 KiB]](Directory_LHCb-PAPER-2012-034/hidef_Table_2.png)
![HiDef png [103 KiB]](Directory_LHCb-PAPER-2012-034/hidef_Table_3.png)
Created on 27 April 2024.