Measurement of the fragmentation fraction ratio $f_{s}/f_{d}$ and its dependence on $B$ meson kinematics
[to restricted-access page]Information
LHCb-PAPER-2012-037
CERN-PH-EP-2013-006
arXiv:1301.5286 [PDF]
(Submitted on 22 Jan 2013)
JHEP 04 (2013) 1
Inspire 1215607
Tools
Abstract
The relative production rate of $B^{0}_{s}$ and $B^{0}$ mesons is determined with the hadronic decays $B^{0}_{s} \rightarrow D^{-}_{s}\pi^{+}$ and $B^0 \rightarrow D^{-}K^{+}$. The measurement uses data corresponding to 1.0 fb$^{-1}$ of $pp$ collisions at a centre-of-mass energy of $\sqrt{s}=7$ TeV recorded in the forward region with the LHCb experiment. The ratio of production rates, $f_{s}/f_{d}$, is measured to be $0.238 \pm 0.004 \pm 0.015 \pm 0.021 $, where the first uncertainty is statistical, the second systematic, and the third theoretical. This is combined with a previous LHCb measurement to obtain $f_{s}/f_{d} = 0.256 \pm 0.020$. The dependence of $f_{s}/f_{d}$ on the transverse momentum and pseudorapidity of the $B$ meson is determined using the decays $B^{0}_{s} \rightarrow D^{-}_{s}\pi^{+}$ and $B^{0} \rightarrow D^{-}\pi^{+}$. There is evidence for a decrease with increasing transverse momentum, whereas the ratio remains constant as a function of pseudorapidity. In addition, the ratio of branching fractions of the decays $B^{0} \rightarrow D^{-}K^{+}$ and $B^{0} \rightarrow D^{-}\pi^{+}$ is measured to be $0.0822 \pm 0.0011 (\textrm{stat}) \pm 0.0025 (\textrm{syst})$.
Figures and captions
|
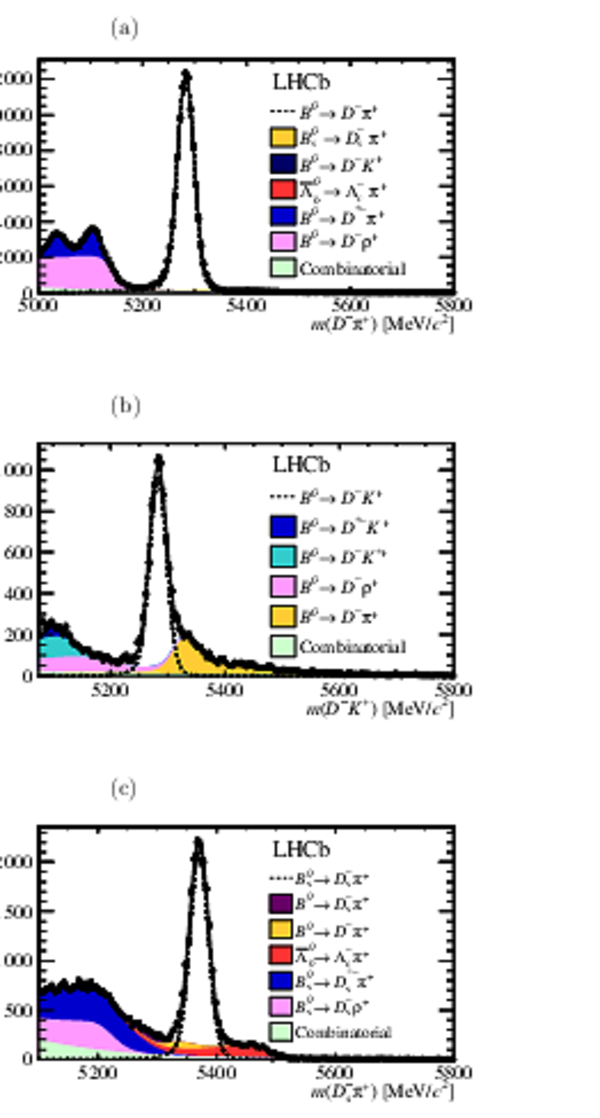
Invariant mass distributions of (a) $ B ^0 \rightarrow D ^- \pi ^+ $ (b) $ B ^0 \rightarrow D ^- K ^+ $ and (c) $ B ^0_ s \rightarrow D ^-_ s \pi ^+ $ candidates. The solid line is the result of the fit and the dotted line indicates the signal. The stacked background shapes follow the same top-to-bottom order in the legend and the plot. The $ B ^0_ s $ and $\overline{\Lambda} ^0_ b $ backgrounds in the $ B ^0 \rightarrow D ^- \pi ^+ $ mass distribution are invisibly small. The resulting signal yields are listed in Table 1. For illustration purposes the figures include events from both magnet polarities, although they are fitted separately as described in the text. |
Fig_1.pdf [149 KiB] HiDef png [578 KiB] Thumbnail [670 KiB] *.C file tex code |
|
|
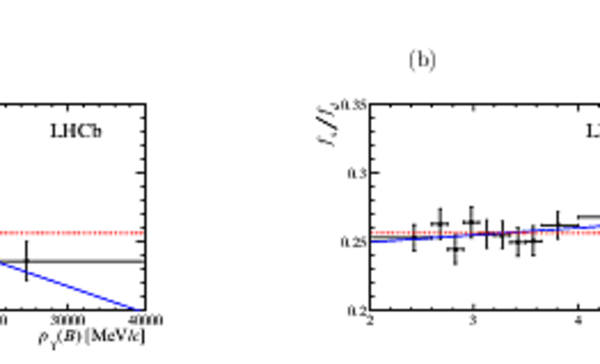
Ratio of fragmentation fractions $ f_s/f_d$ as functions of (a) $p_{\rm T}$ and (b) $\eta$. The errors on the data points are the statistical and uncorrelated systematic uncertainties added in quadrature. The solid line is the result of a linear fit, and the dashed line corresponds to the fit for the no-dependence hypothesis. The average value of $p_{\rm T}$ or $\eta$ is determined for each bin and used as the center of the bin. The horizontal error bars indicate the bin size. Note that the scale is zero suppressed. |
Fig_2.pdf [36 KiB] HiDef png [115 KiB] Thumbnail [118 KiB] *.C file tex code |
|
|
Animated gif made out of all figures. |
PAPER-2012-037.gif Thumbnail |

|
![HiDef png [578 KiB]](Directory_LHCb-PAPER-2012-037/hidef_Fig_1.png)
![HiDef png [115 KiB]](Directory_LHCb-PAPER-2012-037/hidef_Fig_2.png)
Tables and captions
|
Yields obtained from the fits to the invariant mass distributions. |
Table_1.pdf [49 KiB] HiDef png [66 KiB] Thumbnail [29 KiB] tex code |

|
|
Systematic uncertainties for the measurement of the corrected ratio of event yields used for the measurements of $ f_s/f_d$ and the relative branching fraction of $ B ^0 \rightarrow D ^- K ^+ $ . The systematic uncertainty in $p_{\rm T}$ and $\eta$ bins is shown as a range in the last column, and the total systematic uncertainty is the quadratic sum of the uncorrelated uncertainties. The systematic uncertainties on the ratio of $ B ^0 \rightarrow D ^- \pi ^+ $ and $ B ^0_ s \rightarrow D ^-_ s \pi ^+ $ yields that are correlated among the bins do not affect the dependence on $p_{\rm T}$ or $\eta$, and are not accounted for in the total systematic uncertainty. |
Table_2.pdf [70 KiB] HiDef png [76 KiB] Thumbnail [34 KiB] tex code |

|
![HiDef png [66 KiB]](Directory_LHCb-PAPER-2012-037/hidef_Table_1.png)
![HiDef png [76 KiB]](Directory_LHCb-PAPER-2012-037/hidef_Table_2.png)
Created on 02 May 2024.