Information
LHCb-PAPER-2012-038
CERN-PH-EP-2012-333
arXiv:1211.1230 [PDF]
(Submitted on 06 Nov 2012)
Phys. Rev. Lett. 110 (2013) 101802
Inspire 1198431
Tools
Abstract
We report a measurement of the time-dependent ratio of D0->K+pi- to D0->K-pi+ decay rates in D*+-tagged events using 1.0 fb^{-1} of integrated luminosity recorded by the LHCb experiment. We measure the mixing parameters x'2=(-0.9+-1.3)x10^{-4}, y'=(7.2+-2.4)x10^{-3} and the ratio of doubly-Cabibbo-suppressed to Cabibbo-favored decay rates R_D=(3.52+-0.15)x10^{-3}, where the uncertainties include statistical and systematic sources. The result excludes the no-mixing hypothesis with a probability corresponding to 9.1 standard deviations and represents the first observation of D0-D0bar oscillations from a single measurement.
Figures and captions
|
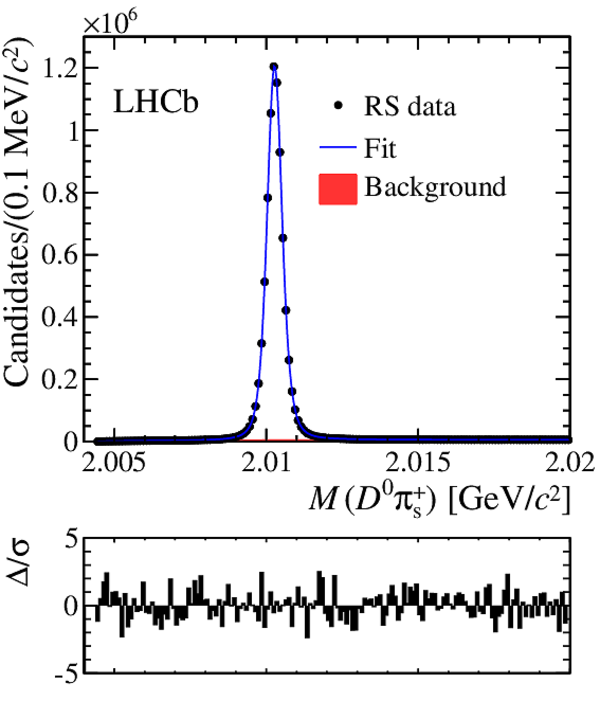
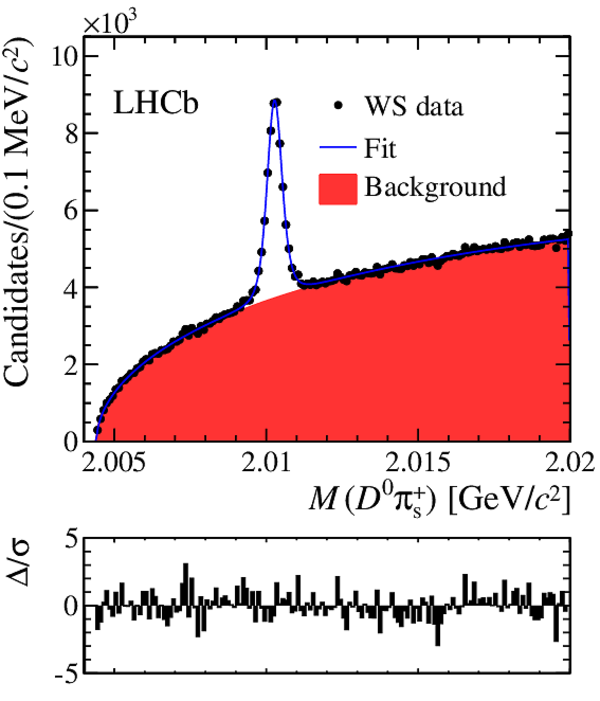
Time-integrated $ D ^0 \pi_{\rm s} ^+$ mass distributions for the selected RS $ D ^0 \rightarrow K^-\pi^+$ (left) and WS $ D ^0 \rightarrow K^+\pi^-$ (right) candidates with fit projections overlaid. The bottom plots show the normalized residuals between the data points and the fits. |
Fig1a.pdf [33 KiB] HiDef png [247 KiB] Thumbnail [229 KiB] *.C file |
|
|
Fig1b.pdf [33 KiB] HiDef png [267 KiB] Thumbnail [238 KiB] *.C file |
|
|
|
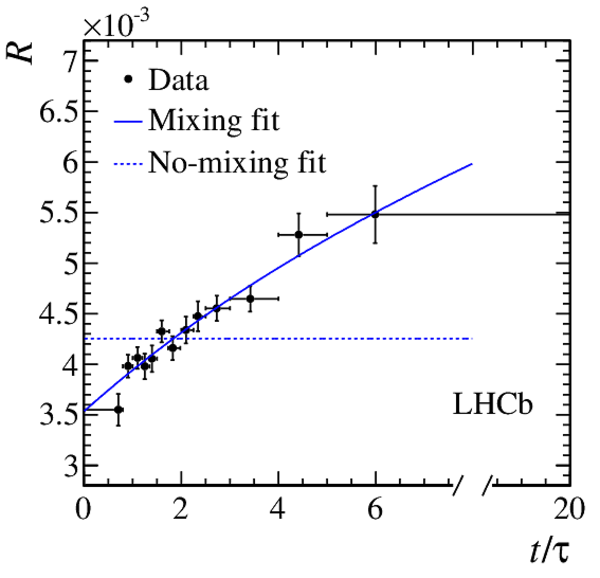
Decay-time evolution of the ratio, $R$, of WS $ D ^0 \rightarrow K^+\pi^-$ to RS $ D ^0 \rightarrow K^-\pi^+$ yields (points) with the projection of the mixing allowed (solid line) and no-mixing (dashed line) fits overlaid. |
Fig2.pdf [13 KiB] HiDef png [159 KiB] Thumbnail [153 KiB] *.C file |
|
|
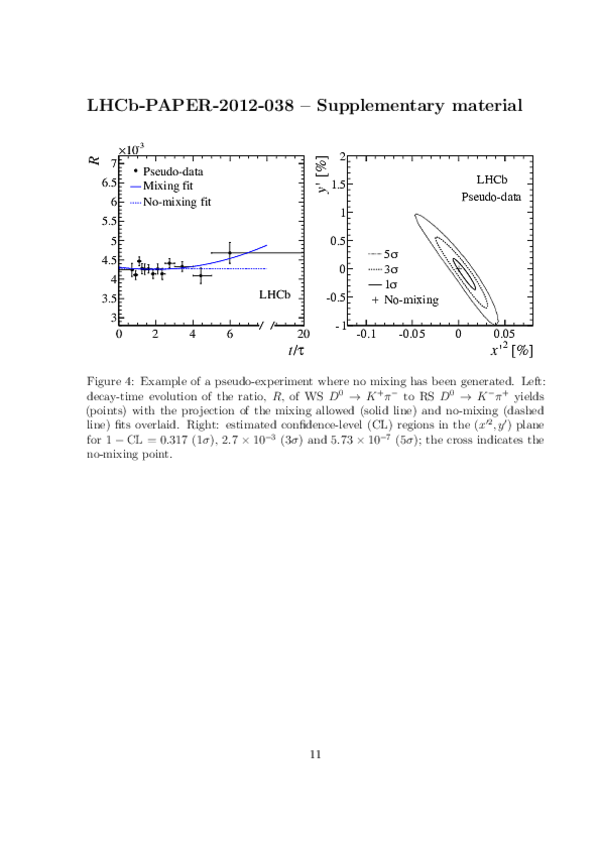
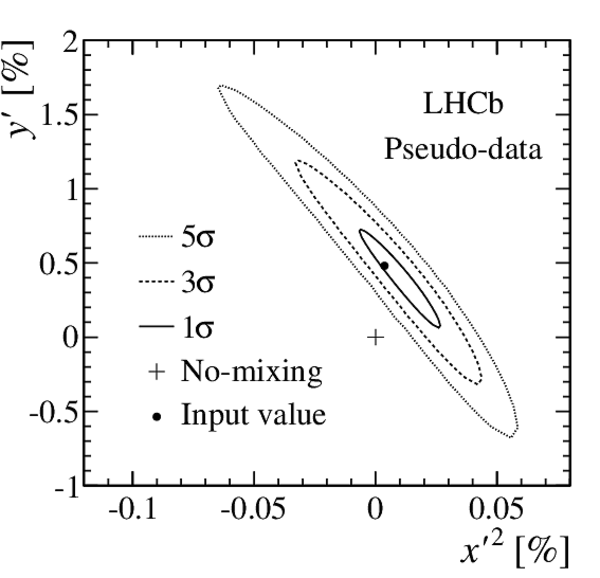
Estimated confidence-level (CL) regions in the $(x'^2,y')$ plane for $1-\text{CL}=0.317$ ($1\sigma$), $2.7\times10^{-3}$ ($3\sigma$) and $5.73\times10^{-7}$ ($5\sigma$). Systematic uncertainties are included. The cross indicates the no-mixing point. |
Fig3.pdf [14 KiB] HiDef png [128 KiB] Thumbnail [75 KiB] *.C file |

|
|
Animated gif made out of all figures. |
PAPER-2012-038.gif Thumbnail |

|
![HiDef png [247 KiB]](Directory_LHCb-PAPER-2012-038/hidef_Fig1a.png)
![HiDef png [267 KiB]](Directory_LHCb-PAPER-2012-038/hidef_Fig1b.png)
![HiDef png [159 KiB]](Directory_LHCb-PAPER-2012-038/hidef_Fig2.png)
![HiDef png [128 KiB]](Directory_LHCb-PAPER-2012-038/hidef_Fig3.png)
Tables and captions
|
Results of the time-dependent fit to the data. The uncertainties include statistical and systematic sources; ndf indicates the number of degrees of freedom. |
Table_1.pdf [54 KiB] HiDef png [48 KiB] Thumbnail [23 KiB] tex code |

|
![HiDef png [48 KiB]](Directory_LHCb-PAPER-2012-038/hidef_Table_1.png)
Supplementary Material [file]
| Supplementary material full pdf |
supple[..].pdf [270 KiB] |
|
|
This archive contains extra figures related to LHCb-PAPER-2012-038 supplementary.pdf - A PDF file with all figures and captions Fig*.pdf - Figures in PDF format Fig*.eps - Figures in EPS format Fig*.png - Figures in PNG format |
Fig4a.pdf [13 KiB] HiDef png [158 KiB] Thumbnail [156 KiB] *C file |

|
|
Fig4b.pdf [14 KiB] HiDef png [124 KiB] Thumbnail [71 KiB] *C file |

|
|
|
Fig5a.pdf [13 KiB] HiDef png [171 KiB] Thumbnail [163 KiB] *C file |

|
|
|
Fig5b.pdf [15 KiB] HiDef png [140 KiB] Thumbnail [81 KiB] *C file |
|
|
|
Fig6a.pdf [12 KiB] HiDef png [167 KiB] Thumbnail [165 KiB] *C file |

|
|
|
Fig6b.pdf [15 KiB] HiDef png [183 KiB] Thumbnail [179 KiB] *C file |

|
|
|
Fig7.pdf [18 KiB] HiDef png [195 KiB] Thumbnail [166 KiB] *C file |

|
|
|
Fig8.pdf [17 KiB] HiDef png [210 KiB] Thumbnail [183 KiB] *C file |

|
|
|
Fig9.pdf [15 KiB] HiDef png [204 KiB] Thumbnail [179 KiB] *C file |

|
![HiDef png [158 KiB]](Directory_LHCb-PAPER-2012-038/supplementary/hidef_Fig4a.png)
![HiDef png [124 KiB]](Directory_LHCb-PAPER-2012-038/supplementary/hidef_Fig4b.png)
![HiDef png [171 KiB]](Directory_LHCb-PAPER-2012-038/supplementary/hidef_Fig5a.png)
![HiDef png [140 KiB]](Directory_LHCb-PAPER-2012-038/supplementary/hidef_Fig5b.png)
![HiDef png [167 KiB]](Directory_LHCb-PAPER-2012-038/supplementary/hidef_Fig6a.png)
![HiDef png [183 KiB]](Directory_LHCb-PAPER-2012-038/supplementary/hidef_Fig6b.png)
![HiDef png [195 KiB]](Directory_LHCb-PAPER-2012-038/supplementary/hidef_Fig7.png)
![HiDef png [210 KiB]](Directory_LHCb-PAPER-2012-038/supplementary/hidef_Fig8.png)
![HiDef png [204 KiB]](Directory_LHCb-PAPER-2012-038/supplementary/hidef_Fig9.png)
Created on 27 April 2024.