Amplitude analysis and the branching fraction measurement of $\bar{B}^0_s \to J/\psi K^+K^-$
[to restricted-access page]Information
LHCb-PAPER-2012-040
CERN-PH-EP-2013-008
arXiv:1302.1213 [PDF]
(Submitted on 05 Feb 2013)
Phys. Rev. D87 (2013) 072004
Inspire 1217862
Tools
Abstract
An amplitude analysis of the final state structure in the Bs->J/\psi K+K- decay mode is performed using 1.0/fb of data collected by the LHCb experiment in 7 TeV center-of-mass energy pp collisions produced by the LHC. A modified Dalitz plot analysis of the final state is performed using both the invariant mass spectra and the decay angular distributions. Resonant structures are observed in the K+K- mass spectrum as well as a significant non-resonant S-wave contribution. The largest resonant component is the \phi(1020), accompanied by f0(980), f'2(1525), and four additional resonances. The overall branching fraction is measured to be B(Bs->J/\psi K+K-)=(7.70 +/-0.08 +/- 0.39 +/- 0.60)x 10^(-4), where the first uncertainty is statistical, the second systematic, and the third due to the ratio of the number of Bs to B- mesons produced. The mass and width of the f'2(1525) are measured to be 1522.2 +/- 2.8^{+5.3}_{-2.0} MeV and 84 +/- 6^{+10}_{-5} MeV, respectively. The final state fractions of the other resonant states are also reported.
Figures and captions
|
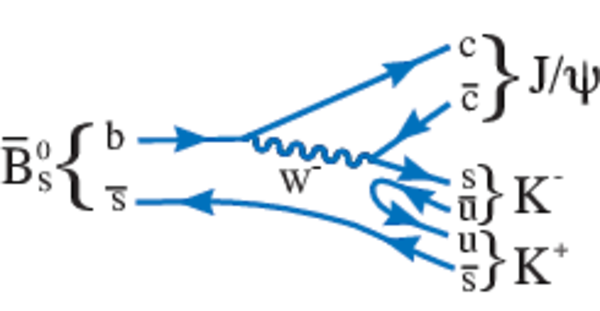
Leading order diagram for $\overline{ B }{} ^0_ s \rightarrow J/\psi K ^+ K ^- $. |
BstoJpsiKK.pdf [75 KiB] HiDef png [139 KiB] Thumbnail [194 KiB] *.C file |
|
|
Invariant mass spectrum of $J/\psi K^+K^-$ combinations. The vertical lines indicate the signal (black-dotted) and sideband (red-dashed) regions. |
Bs_mass.pdf [37 KiB] HiDef png [357 KiB] Thumbnail [201 KiB] *.C file |

|
|
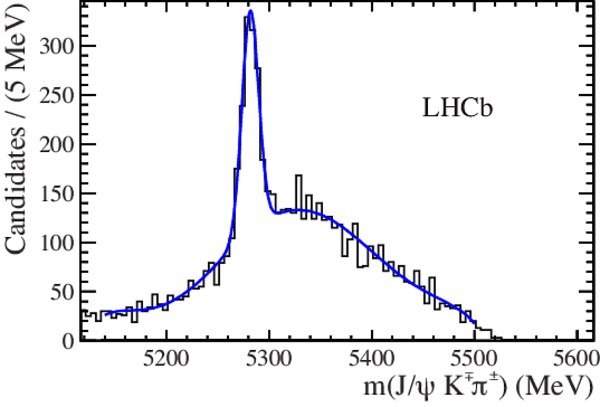
Invariant mass distribution for $J/\psi K ^+ K ^- $ candidates $25-200$ MeV above the $\overline{ B }{} ^0_ s $ mass, reinterpreted as $\overline{ B }{} ^0 \rightarrow J/\psi K^{\mp} \pi^{\pm}$ events. The fit is to a signal Gaussian whose mass and width are allowed to vary as well as the polynomial background. |
reflection.pdf [38 KiB] HiDef png [172 KiB] Thumbnail [155 KiB] *.C file |
|
|
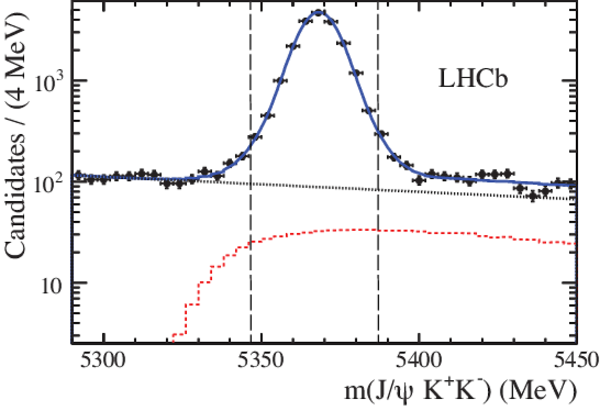
Fit to the invariant mass spectrum of $J/\psi K^+K^-$ combinations. The dotted (black) line is the combinatorial background, the dashed (red) shape shows the misidentified $\overline{ B }{} ^0 \rightarrow J/\psi K ^- \pi ^+ $decays, and the solid (blue) curve shows the total. The vertical dashed lines indicate the signal region. |
Bs2JpsiKK2.pdf [39 KiB] HiDef png [224 KiB] Thumbnail [182 KiB] *.C file |
|
|
Fit to the invariant mass spectrum of $J/\psi K ^- $ candidates. The dotted line shows the combinatorial background and the solid (blue) curve is the total. |
Bu2JpsiK.pdf [35 KiB] HiDef png [185 KiB] Thumbnail [155 KiB] *.C file |

|
|
Distribution of $m^2(K^+K^-)$ versus $m^2(J/\psi K^+)$ for $\overline{ B }{} ^0_ s $ candidate decays within $\pm 20$ MeV of the $\overline{ B }{} ^0_ s $ mass. The horizontal bands result from the $\phi(1020)$ and $f_2'(1525)$ resonances. |
dalitz.pdf [162 KiB] HiDef png [611 KiB] Thumbnail [508 KiB] *.C file |

|
|
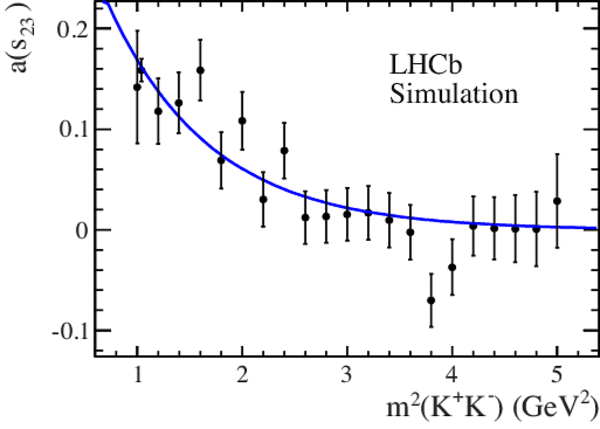
Exponential fit to the efficiency parameter $a(s_{23})$. The point near the $\phi(1020)$ meson mass is determined more precisely due to the use of a large simulation sample. |
cosHacc.pdf [34 KiB] HiDef png [146 KiB] Thumbnail [125 KiB] *.C file |
|
|
Parametrized detection efficiency as a function of $m^2(K^+K^-)$ versus $m^2(J/\psi K^+)$. The z-axis scale is arbitrary. |
effmodel.pdf [4 MiB] HiDef png [2 MiB] Thumbnail [573 KiB] *.C file |

|
|
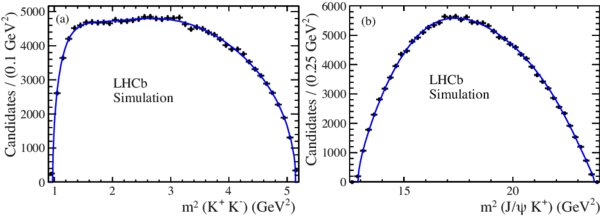
Projections of the invariant mass squared (a) $K^+K^-$ and (b) $J/\psi K^{+}$ from the simulation used to measure the efficiency parameters. The points represent the generated event distributions and the curves the polynomial fit. |
eff.pdf [36 KiB] HiDef png [172 KiB] Thumbnail [124 KiB] *.C file |
|
|
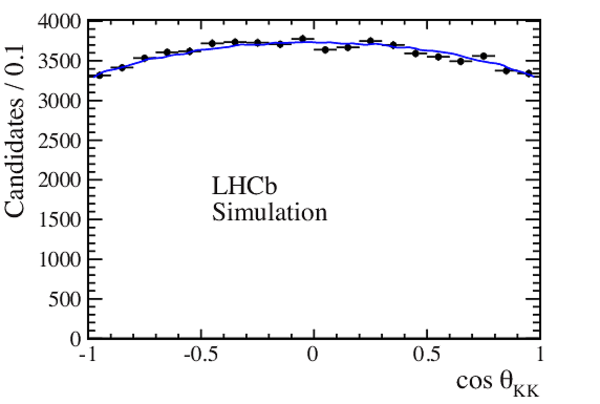
Distribution of $\cos \theta_{KK}$ for the $J/\psi \phi$ simulated sample fitted with $\varepsilon_1(x,y )\times A(\theta_{KK})$, within $\pm 20$ MeV of the $\phi(1020)$ mass. |
cosK_Phi.pdf [34 KiB] HiDef png [224 KiB] Thumbnail [128 KiB] *.C file |
|
|
Invariant mass squared projections of (a) $K^+K^-$ and (b) $J/\psi K^{+}$ from the background Dalitz plot of candidates in the $\overline{ B }{} ^0_ s $ mass sidebands. |
bkg.pdf [36 KiB] HiDef png [166 KiB] Thumbnail [131 KiB] *.C file |

|
|
Distribution of $\cos \theta_{J/\psi}$ from the background sample fit with the function $1+\alpha \cos^{2} \theta_{J/\psi}$. |
bkgcosH.pdf [34 KiB] HiDef png [171 KiB] Thumbnail [113 KiB] *.C file |

|
|
Projections of the reflection background in the variables (a) $ m^2(K^+K^-)$ and (b) $ m^2(J/\psi K^{+})$, obtained from $\overline{ B }{} ^0 \rightarrow J/\psi \overline{ K }{} ^{*0} (892)$ and $\overline{ B }{} ^0 \rightarrow J/\psi \overline{ K }{} ^* _2(1430)$ simulations. |
ref.pdf [28 KiB] HiDef png [50 KiB] Thumbnail [74 KiB] *.C file |

|
|
Distribution of $\cos \theta_{J/\psi}$ for the reflection fit with the function $1+\beta \cos^{2} \theta_{J/\psi}$. |
refcosH.pdf [35 KiB] HiDef png [237 KiB] Thumbnail [141 KiB] *.C file |

|
|
Dalitz plot fit projection of $ m^2(K^+ K^-)$ using a logarithmic scale. The points with error bars are data, the (black) dotted curve shows the combinatorial background, the (red) dashed curve indicates the reflection from the misidentified $\overline{ B }{} ^0 \rightarrow J/\psi K ^- \pi ^+ $ decays, and the (blue) solid line represents the total. |
ylog.pdf [39 KiB] HiDef png [168 KiB] Thumbnail [132 KiB] *.C file |

|
|
Dalitz plot fit projections of (a) $ m^2(J/\psi K^{+})$ and (b) $\cos \theta_{J/\psi}$. The points with error bars are data, the (black) dotted curve shows the combinatorial background, the (red) dashed curve indicates the reflection from the misidentified $\overline{ B }{} ^0 \rightarrow J/\psi K ^- \pi ^+ $ decays, and the (blue) solid line represents the total fit results. |
x-cosH.pdf [35 KiB] HiDef png [204 KiB] Thumbnail [133 KiB] *.C file |

|
|
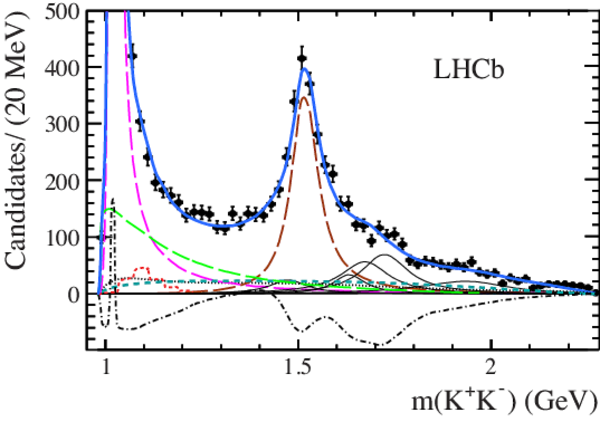
Dalitz fit projection of $m(K^+ K^-)$. The points represent the data, the dotted (black) curve shows the combinatorial background, and the dashed (red) curve indicates the reflection from misidentified $\overline{ B }{} ^0 \rightarrow J/\psi K ^- \pi ^+ $ decays. The largest three resonances $\phi(1020)$, $f_2'(1525)$ and $f_0(980)$ are shown by magenta, brown and green long-dashed curves, respectively; all other resonances are shown by thin black curves. The dashed (cyan) curve is the non-resonant contribution. The dot-dashed (black) curve is the contribution from the interferences, and the solid (blue) curve represents the total fit result. |
mass-fix.pdf [51 KiB] HiDef png [287 KiB] Thumbnail [209 KiB] *.C file |
|
|
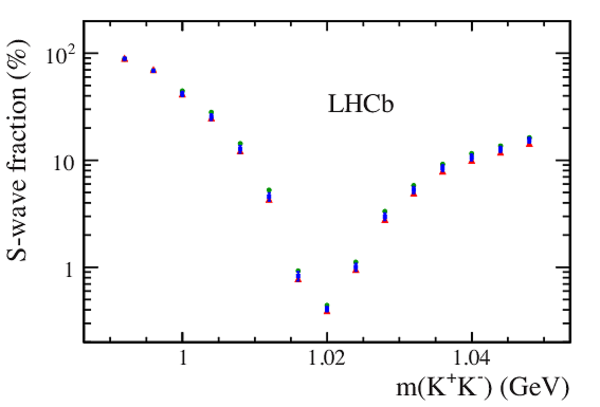
S-wave fraction as a function of $m( K ^+ K ^- )$ starting from 990 MeV up to 1050 MeV in 4 MeV mass intervals. The squares (blue), triangles (red), and circles (green) represent the LHCb , BES and BaBar parameterizations of $f_0(980)$, respectively. The experimental statistical uncertainties are only shown for the LHCb model; they are almost identical for the other cases. The experimental mass resolution is not unfolded. |
swave3.pdf [29 KiB] HiDef png [143 KiB] Thumbnail [83 KiB] *.C file |
|
|
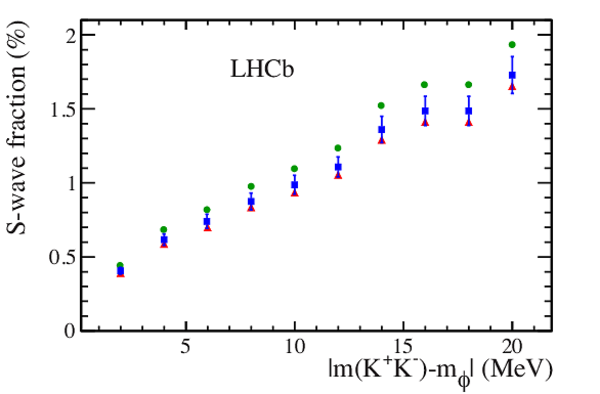
S-wave fractions in different $m( K ^+ K ^- )$ intervals centered on the $\phi$ meson mass. The squares (blue), triangles (red), and circles (green) represent the LHCb , BES and BaBar parameterizations of $f_0(980)$, respectively. The experimental statistical uncertainties are only shown for the LHCb model; they are almost identical for the other cases. The experimental mass resolution is not unfolded. |
interval.pdf [31 KiB] HiDef png [160 KiB] Thumbnail [93 KiB] *.C file |
|
|
Background-subtracted efficiency-corrected $\cos \theta_{J/\psi}$ helicity distributions: (a) in $\phi(1020)$ mass region ($\chi^2/\rm ndf =54.4/40$), (b) in $f_2'(1525)$ mass region ($\chi^2/\rm ndf =34.4/40$). |
bgsubc[..].pdf [32 KiB] HiDef png [142 KiB] Thumbnail [116 KiB] *.C file |

|
|
Background-subtracted efficiency-corrected $\cos \theta_{KK}$ helicity distributions: (a) in $\phi(1020)$ mass region ($\chi^2/\rm ndf =57.4/40$), (b) in $f_2'(1525)$ mass region ($\chi^2/\rm ndf =43.4/40$). The distributions are compatible with expectations for spin-1 and spin-2, respectively. |
bgsubc[..].pdf [34 KiB] HiDef png [221 KiB] Thumbnail [134 KiB] *.C file |

|
|
bgsubc[..].pdf [34 KiB] HiDef png [213 KiB] Thumbnail [133 KiB] *.C file |

|
|
|
Dependence of the spherical harmonic moments of $\cos \theta_{KK}$ as a function of the $K^+K^-$ mass around the $\phi(1020)$ mass peak after efficiency corrections and background subtraction. The points with error bars are the data and the solid curves are derived from the fit model. |
ang-mo[..].pdf [70 KiB] HiDef png [329 KiB] Thumbnail [221 KiB] *.C file |

|
|
Dependence of the spherical harmonic moments of $\cos \theta_{KK}$ as a function of the $K^+K^-$ mass above 1050 MeV, after efficiency corrections and background subtraction. The points with error bars are the data and the solid curves are derived from the fit model. |
ang-mom-hm.pdf [60 KiB] HiDef png [279 KiB] Thumbnail [204 KiB] *.C file |

|
|
Animated gif made out of all figures. |
PAPER-2012-040.gif Thumbnail |

|
![HiDef png [139 KiB]](Directory_LHCb-PAPER-2012-040/hidef_BstoJpsiKK.png)
![HiDef png [357 KiB]](Directory_LHCb-PAPER-2012-040/hidef_Bs_mass.png)
![HiDef png [172 KiB]](Directory_LHCb-PAPER-2012-040/hidef_reflection.png)
![HiDef png [224 KiB]](Directory_LHCb-PAPER-2012-040/hidef_Bs2JpsiKK2.png)
![HiDef png [185 KiB]](Directory_LHCb-PAPER-2012-040/hidef_Bu2JpsiK.png)
![HiDef png [611 KiB]](Directory_LHCb-PAPER-2012-040/hidef_dalitz.png)
![HiDef png [146 KiB]](Directory_LHCb-PAPER-2012-040/hidef_cosHacc.png)
![HiDef png [2 MiB]](Directory_LHCb-PAPER-2012-040/hidef_effmodel.png)
![HiDef png [172 KiB]](Directory_LHCb-PAPER-2012-040/hidef_eff.png)
![HiDef png [224 KiB]](Directory_LHCb-PAPER-2012-040/hidef_cosK_Phi.png)
![HiDef png [166 KiB]](Directory_LHCb-PAPER-2012-040/hidef_bkg.png)
![HiDef png [171 KiB]](Directory_LHCb-PAPER-2012-040/hidef_bkgcosH.png)
![HiDef png [50 KiB]](Directory_LHCb-PAPER-2012-040/hidef_ref.png)
![HiDef png [237 KiB]](Directory_LHCb-PAPER-2012-040/hidef_refcosH.png)
![HiDef png [168 KiB]](Directory_LHCb-PAPER-2012-040/hidef_ylog.png)
![HiDef png [204 KiB]](Directory_LHCb-PAPER-2012-040/hidef_x-cosH.png)
![HiDef png [287 KiB]](Directory_LHCb-PAPER-2012-040/hidef_mass-fix.png)
![HiDef png [143 KiB]](Directory_LHCb-PAPER-2012-040/hidef_swave3.png)
![HiDef png [160 KiB]](Directory_LHCb-PAPER-2012-040/hidef_interval.png)
![HiDef png [142 KiB]](Directory_LHCb-PAPER-2012-040/hidef_bgsubcosH_phi-f2.png)
![HiDef png [221 KiB]](Directory_LHCb-PAPER-2012-040/hidef_bgsubcosK_phi.png)
![HiDef png [213 KiB]](Directory_LHCb-PAPER-2012-040/hidef_bgsubcosK_f2.png)
![HiDef png [329 KiB]](Directory_LHCb-PAPER-2012-040/hidef_ang-mom-phi.png)
![HiDef png [279 KiB]](Directory_LHCb-PAPER-2012-040/hidef_ang-mom-hm.png)
Tables and captions
|
Possible resonance candidates in the $\overline{ B }{} ^0_ s \rightarrow J/\psi K^+K^-$ decay mode. |
Table_1.pdf [45 KiB] HiDef png [56 KiB] Thumbnail [27 KiB] tex code |

|
|
Breit-Wigner resonance parameters. |
Table_2.pdf [55 KiB] HiDef png [128 KiB] Thumbnail [64 KiB] tex code |

|
|
$\chi^2/\text{ndf}$ and $\rm -ln\mathcal{L}$ of different resonance models. |
Table_3.pdf [37 KiB] HiDef png [59 KiB] Thumbnail [28 KiB] tex code |

|
|
Fit fractions (%) and phases of contributing components. For P- and D-waves $\lambda$ represents the helicity. |
Table_4.pdf [56 KiB] HiDef png [185 KiB] Thumbnail [95 KiB] tex code |

|
|
Fit fractions matrix for the best fit in units of %. The diagonal elements correspond to the decay fractions in Table ???. The off-diagonal elements give the fit fractions of the interference. The null values originate from the fact that any interference contribution between different spin-$J$ state integrates to zero. Here the resonances are labeled by their masses in MeV and the subscripts denote the helicities. |
Table_5.pdf [20 KiB] HiDef png [49 KiB] Thumbnail [20 KiB] tex code |

|
|
Comparison of the fit fractions (%) with the LHCb, BES and BaBar $f_0(980)$ parameterizations described in the text. For P- and D-waves, $\lambda$ represents the helicity. |
Table_6.pdf [48 KiB] HiDef png [150 KiB] Thumbnail [76 KiB] tex code |

|
|
Absolute systematic uncertainties on the fit results. |
Table_7.pdf [73 KiB] HiDef png [182 KiB] Thumbnail [91 KiB] tex code |

|
|
Detector efficiencies determined from simulation and the correction factors. |
Table_8.pdf [54 KiB] HiDef png [66 KiB] Thumbnail [31 KiB] tex code |

|
|
Relative systematic uncertainties on branching fractions (%). |
Table_9.pdf [59 KiB] HiDef png [102 KiB] Thumbnail [47 KiB] tex code |

|
![HiDef png [56 KiB]](Directory_LHCb-PAPER-2012-040/hidef_Table_1.png)
![HiDef png [128 KiB]](Directory_LHCb-PAPER-2012-040/hidef_Table_2.png)
![HiDef png [59 KiB]](Directory_LHCb-PAPER-2012-040/hidef_Table_3.png)
![HiDef png [185 KiB]](Directory_LHCb-PAPER-2012-040/hidef_Table_4.png)
![HiDef png [49 KiB]](Directory_LHCb-PAPER-2012-040/hidef_Table_5.png)
![HiDef png [150 KiB]](Directory_LHCb-PAPER-2012-040/hidef_Table_6.png)
![HiDef png [182 KiB]](Directory_LHCb-PAPER-2012-040/hidef_Table_7.png)
![HiDef png [66 KiB]](Directory_LHCb-PAPER-2012-040/hidef_Table_8.png)
![HiDef png [102 KiB]](Directory_LHCb-PAPER-2012-040/hidef_Table_9.png)
Created on 27 April 2024.