Information
LHCb-PAPER-2012-041
CERN-PH-EP-2013-009
arXiv:1302.2864 [PDF]
(Submitted on 12 Feb 2013)
Nucl. Phys. B871 (2013) 1
Inspire 1218996
Tools
Abstract
Charm production at the LHC in pp collisions at sqrt(s)=7 TeV is studied with the LHCb detector. The decays D0 -> K- pi+, D+ -> K- pi+ pi+, D*+ -> D0(K- pi+) pi+, D_s+ -> phi(K- K+) pi+, Lambda_c+ -> p K- pi+, and their charge conjugates are analysed in a data set corresponding to an integrated luminosity of 15 nb^{-1}. Differential cross-sections dsigma/dp_T are measured for prompt production of the five charmed hadron species in bins of transverse momentum and rapidity in the region 0 < p_T < 8 GeV/c and 2.0 < y < 4.5. Theoretical predictions are compared to the measured differential cross-sections. The integrated cross-sections of the charm hadrons are computed in the above p_T-y range, and their ratios are reported. A combination of the five integrated cross-section measurements gives sigma(c\bar{c})_{p_T < 8 GeV/c, 2.0 < y < 4.5} = 1419 +/- 12 (stat) +/- 116 (syst) +/- 65 (frag) microbarn, where the uncertainties are statistical, systematic, and due to the fragmentation functions.
Figures and captions
|
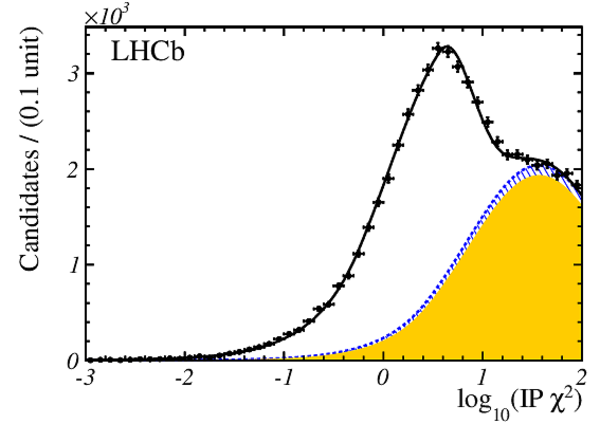
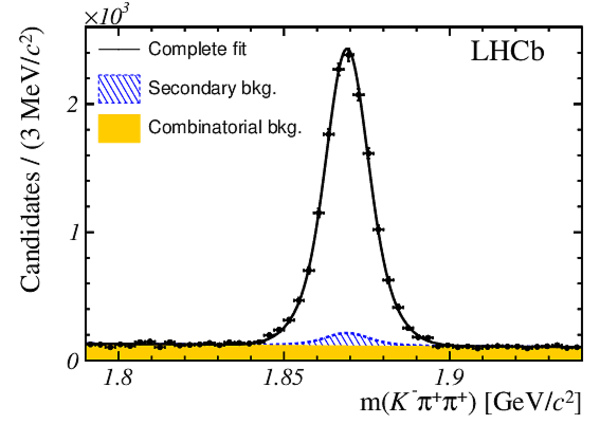
Mass and $\log_{10}(\mathrm{IP} \chi^2 )$ distributions for selected $ D ^0 \rightarrow K ^- \pi ^+ $ and $ D ^+ \rightarrow K ^- \pi ^+ \pi ^+ $ candidates showing \subref{fig:Dz:m:m} the masses of the $ D ^0$ candidates, \subref{fig:Dz:m:ip} the $\log_{10}(\mathrm{IP} \chi^2 )$ distribution of $ D ^0$ candidates for a mass window of $\pm 16 {\mathrm{ Me V /}c^2} $ (approximately $\pm 2\sigma$) around the fitted $m( K ^- \pi ^+ )$ peak, \subref{fig:Dp:m:m} the masses of the $ D ^+$ candidates, and \subref{fig:Dp:m:ip} the $\log_{10}(\mathrm{IP} \chi^2 )$ distribution of $ D ^+$ candidates for a mass window of $\pm 11 {\mathrm{ Me V /}c^2} $ (approximately $\pm 2\sigma$) around the fitted $m( K ^- \pi ^+ \pi ^+ )$ peak. Projections of likelihood fits to the full data samples are shown with components as indicated in the legends. \label{fig:Dp:m} |
Figure[..].pdf [21 KiB] HiDef png [186 KiB] Thumbnail [155 KiB] *.C file |

|
|
Figure[..].pdf [22 KiB] HiDef png [154 KiB] Thumbnail [124 KiB] *.C file |
|
|
|
Figure[..].pdf [21 KiB] HiDef png [182 KiB] Thumbnail [153 KiB] *.C file |
|
|
|
Figure[..].pdf [30 KiB] HiDef png [129 KiB] Thumbnail [108 KiB] *.C file |

|
|
|
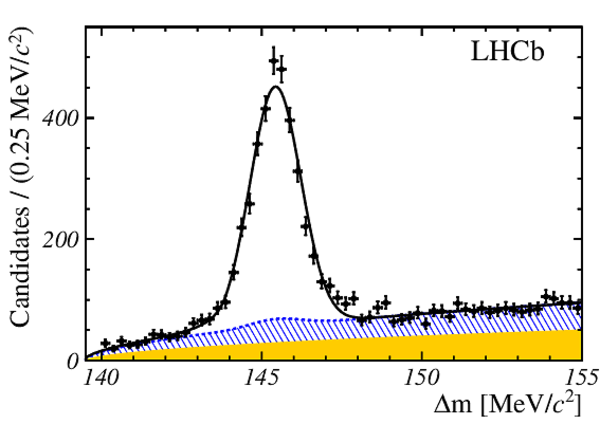
Mass and $\log_{10}(\mathrm{IP} \chi^2 )$ distributions for selected $ D ^{*+} \rightarrow D ^0 ( K ^- \pi ^+ ) \pi ^+ $ candidates showing \subref{fig:Dstarp:m:mkpi} the masses of the $ D ^0$ candidates for a window of $\pm 1.6 {\mathrm{ Me V /}c^2} $ (approximately $\pm 2\sigma$) around the fitted $\Delta m $ peak, \subref{fig:Dstarp:m:delm} the differences between the $ D ^{*+}$ and $ D ^0$ candidate masses for a mass window of $\pm 16 {\mathrm{ Me V /}c^2} $ (approximately $\pm 2\sigma$) around the fitted $m( K ^- \pi ^+ )$ peak, and \subref{fig:Dstarp:m:ip} the $\log_{10}(\mathrm{IP} \chi^2 )$ distribution of the $ D ^0$ candidate for a mass signal box of $\pm 16 {\mathrm{ Me V /}c^2} $ around the fitted $m( K ^- \pi ^+ )$ peak and $\pm 1.6 {\mathrm{ Me V /}c^2} $ around the fitted $\Delta m $ peak. Projections of a likelihood fit to the full data sample are shown with components as indicated in the legend. The ` $ D ^0$ backgrounds' component is the sum of the secondary, prompt random slow pion, and secondary random slow pion backgrounds. |
Figure[..].pdf [21 KiB] HiDef png [209 KiB] Thumbnail [172 KiB] *.C file |

|
|
Figure[..].pdf [22 KiB] HiDef png [222 KiB] Thumbnail [161 KiB] *.C file |
|
|
|
Figure[..].pdf [21 KiB] HiDef png [180 KiB] Thumbnail [145 KiB] *.C file |

|
|
|
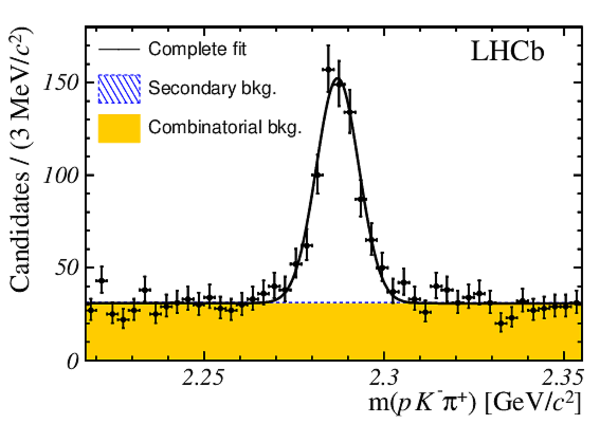
Mass and $\log_{10}(\mathrm{IP} \chi^2 )$ distributions for selected $ D ^+_ s \rightarrow \phi ( K ^- K ^+ ) \pi ^+ $ and $\Lambda _ c ^+ \rightarrow p K ^- \pi ^+ $ candidates showing \subref{fig:Ds:m:m} the masses of the $ D ^+_ s $ candidates, \subref{fig:Ds:m:ip} the $\log_{10}(\mathrm{IP} \chi^2 )$ distribution of $ D ^+_ s $ candidates for a mass window of $\pm 8 {\mathrm{ Me V /}c^2} $ (approximately $\pm 2\sigma$) around the fitted $m(\phi ( K ^- K ^+ )\pi ^+ )$ peak, \subref{fig:Lcp:m:m} the masses of the $\Lambda _ c ^+$ candidates, and \subref{fig:Lcp:m:ip} the $\log_{10}(\mathrm{IP} \chi^2 )$ distribution of $\Lambda _ c ^+$ candidates for a mass window of $\pm 12 {\mathrm{ Me V /}c^2} $ (approximately $\pm 2\sigma$) around the fitted $m( p K ^- \pi ^+ )$ peak. Projections of likelihood fits to the full data samples are shown with components as indicated in the legends. \label{fig:Lcp:m} |
Figure[..].pdf [21 KiB] HiDef png [205 KiB] Thumbnail [178 KiB] *.C file |

|
|
Figure[..].pdf [29 KiB] HiDef png [151 KiB] Thumbnail [127 KiB] *.C file |

|
|
|
Figure[..].pdf [20 KiB] HiDef png [198 KiB] Thumbnail [178 KiB] *.C file |
|
|
|
Figure[..].pdf [28 KiB] HiDef png [142 KiB] Thumbnail [125 KiB] *.C file |

|
|
|
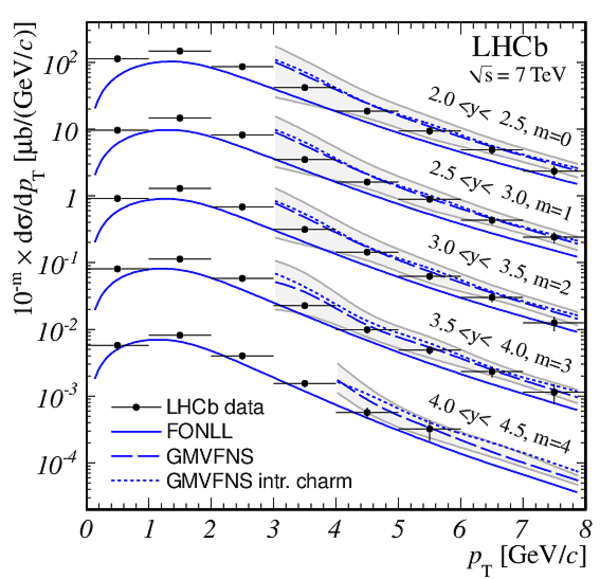
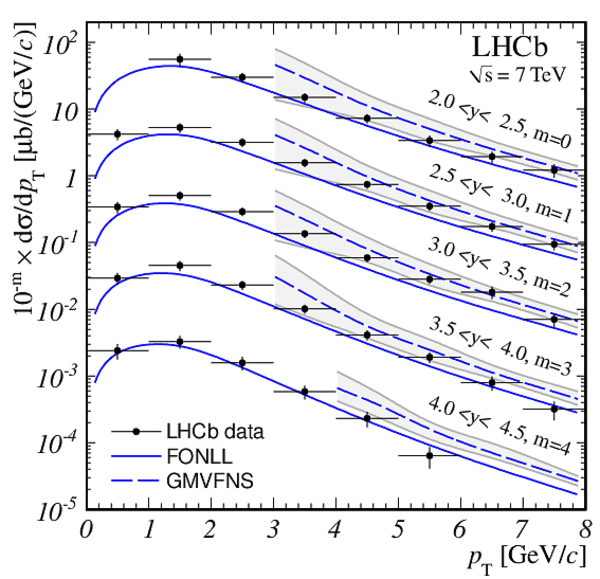
Differential cross-sections for \subref{fig:lhcb:Dz:a} $ D ^0$ , \subref{fig:lhcb:Dp:b} $ D ^+$ , \subref{fig:lhcb:dstar:a} $ D ^{*+}$ , and \subref{fig:lhcb:Dsp:b} $ D ^+_ s $ meson production compared to theoretical predictions. The cross-sections for different $y$ regions are shown as functions of $p_{\rm T}$ . The $y$ ranges are shown as separate curves and associated sets of points scaled by factors $10^{-m}$, where the exponent $m$ is shown on the plot with the $y$ range. The error bars associated with the data points show the sum in quadrature of the statistical and total systematic uncertainty. The shaded regions show the range of theoretical uncertainties for the GMVFNS prediction. \label{fig:lhcb:Dp} \label{fig:lhcb:dstar} \label{fig:lhcb:Dsp} |
Figure[..].pdf [29 KiB] HiDef png [656 KiB] Thumbnail [473 KiB] *.C file |
|
|
Figure[..].pdf [27 KiB] HiDef png [580 KiB] Thumbnail [452 KiB] *.C file |
|
|
|
Figure[..].pdf [26 KiB] HiDef png [572 KiB] Thumbnail [442 KiB] *.C file |

|
|
|
Figure[..].pdf [27 KiB] HiDef png [573 KiB] Thumbnail [455 KiB] *.C file |

|
|
|
Differential cross-sections for $\Lambda _ c ^+$ baryon production compared to the theoretical prediction from the GMVFNS scheme. The error bars associated with the data points show the sum in quadrature of the statistical and total systematic uncertainty. The shaded region shows the range of theoretical uncertainty for the theoretical prediction. |
Figure[..].pdf [14 KiB] HiDef png [198 KiB] Thumbnail [171 KiB] *.C file |

|
|
Animated gif made out of all figures. |
PAPER-2012-041.gif Thumbnail |

|
![HiDef png [186 KiB]](Directory_LHCb-PAPER-2012-041/hidef_Figure_1a_Dzero_mass.png)
![HiDef png [154 KiB]](Directory_LHCb-PAPER-2012-041/hidef_Figure_1b_Dzero_ipsig.png)
![HiDef png [182 KiB]](Directory_LHCb-PAPER-2012-041/hidef_Figure_1c_Dplus_mass.png)
![HiDef png [129 KiB]](Directory_LHCb-PAPER-2012-041/hidef_Figure_1d_Dplus_ipsig.png)
![HiDef png [209 KiB]](Directory_LHCb-PAPER-2012-041/hidef_Figure_2a_Dstar_mass.png)
![HiDef png [222 KiB]](Directory_LHCb-PAPER-2012-041/hidef_Figure_2b_Dstar_deltam.png)
![HiDef png [180 KiB]](Directory_LHCb-PAPER-2012-041/hidef_Figure_2c_Dstar_ipsig.png)
![HiDef png [205 KiB]](Directory_LHCb-PAPER-2012-041/hidef_Figure_3a_Dsplus_mass.png)
![HiDef png [151 KiB]](Directory_LHCb-PAPER-2012-041/hidef_Figure_3b_Dsplus_ipsig.png)
![HiDef png [198 KiB]](Directory_LHCb-PAPER-2012-041/hidef_Figure_3c_Lambdacp_mass.png)
![HiDef png [142 KiB]](Directory_LHCb-PAPER-2012-041/hidef_Figure_3d_Lambdacp_ipsig.png)
![HiDef png [656 KiB]](Directory_LHCb-PAPER-2012-041/hidef_Figure_4a_DzeroTH.png)
![HiDef png [580 KiB]](Directory_LHCb-PAPER-2012-041/hidef_Figure_4b_DplusTH.png)
![HiDef png [572 KiB]](Directory_LHCb-PAPER-2012-041/hidef_Figure_4c_DstarTH.png)
![HiDef png [573 KiB]](Directory_LHCb-PAPER-2012-041/hidef_Figure_4d_DsplusTH.png)
![HiDef png [198 KiB]](Directory_LHCb-PAPER-2012-041/hidef_Figure_5_LambdacTH.png)
Tables and captions
|
Overview of systematic uncertainties and their values, expressed as relative fractions of the cross-section measurements in percent (%). Uncertainties that are computed bin-by-bin are expressed as ranges giving the minimum to maximum values of the bin uncertainties. The correlated and uncorrelated uncertainties are shown as discussed in the text. |
Table_1.pdf [47 KiB] HiDef png [67 KiB] Thumbnail [30 KiB] tex code |

|
|
Open charm production cross-sections in the kinematic range $ 0 < p_{\rm T} < 8 {\mathrm{ Ge V /}c} $ and $ 2.0 < y < 4.5$ . The computation of the extrapolation factors is described in the text. The first uncertainty is statistical, the second is systematic, and the third is the contribution from the extrapolation factor. |
Table_2.pdf [53 KiB] HiDef png [65 KiB] Thumbnail [32 KiB] tex code |

|
|
Correlation matrix of the uncertainties of the integrated open charm production cross-sections in the kinematic range $ 0 < p_{\rm T} < 8 {\mathrm{ Ge V /}c} $ and $ 2.0 < y < 4.5$ . The first column restates measured values of the integrated cross-sections . |
Table_3.pdf [51 KiB] HiDef png [45 KiB] Thumbnail [23 KiB] tex code |

|
|
Cross-section ratios for open charm production in the kinematic range $ 0 < p_{\rm T} < 8 {\mathrm{ Ge V /}c} $ and $ 2.0 < y < 4.5$ . The numbers in the table are the ratios of the respective row/column. |
Table_4.pdf [47 KiB] HiDef png [44 KiB] Thumbnail [21 KiB] tex code |

|
|
Bin-integrated production cross-sections in $ {\rm \upmu b}$ for prompt $\Lambda _ c ^+$ $+$ c.c. baryons in bins of $y$ integrated over the range $2 < p_{\rm T} < 8 {\mathrm{ Ge V /}c} $. The first uncertainty is statistical, and the second is the total systematic. |
Table_5.pdf [34 KiB] HiDef png [23 KiB] Thumbnail [11 KiB] tex code |

|
|
Differential production cross-sections , $\mathrm{d}\hspace{-0.1em}\sigma/\mathrm{d} p_{\rm T} $ , in $ {\rm \upmu b} /( {\mathrm{Ge V /}c} )$ for prompt $\Lambda _ c ^+$ $+$ c.c. baryons in bins of $ p_{\rm T} $ integrated over the rapidity range $ 2.0 < y < 4.5$ . The first uncertainty is statistical, and the second is the total systematic. |
Table_6.pdf [35 KiB] HiDef png [114 KiB] Thumbnail [50 KiB] tex code |

|
|
Differential production cross-sections , $\mathrm{d}\hspace{-0.1em}\sigma/\mathrm{d} p_{\rm T} $ , in $ {\rm \upmu b} /( {\mathrm{Ge V /}c} )$ for prompt $ D ^0$ $+$ c.c. mesons in bins of $( p_{\rm T} , y)$. The first uncertainty is statistical, and the second is the total systematic. |
[Error creating the table] | |
|
Differential production cross-sections , $\mathrm{d}\hspace{-0.1em}\sigma/\mathrm{d} p_{\rm T} $ , in $ {\rm \upmu b} /( {\mathrm{Ge V /}c} )$ for prompt $ D ^{*+}$ $+$ c.c. mesons in bins of $( p_{\rm T} , y)$. The first uncertainty is statistical, and the second is the total systematic. |
[Error creating the table] |
![HiDef png [67 KiB]](Directory_LHCb-PAPER-2012-041/hidef_Table_1.png)
![HiDef png [65 KiB]](Directory_LHCb-PAPER-2012-041/hidef_Table_2.png)
![HiDef png [45 KiB]](Directory_LHCb-PAPER-2012-041/hidef_Table_3.png)
![HiDef png [44 KiB]](Directory_LHCb-PAPER-2012-041/hidef_Table_4.png)
![HiDef png [23 KiB]](Directory_LHCb-PAPER-2012-041/hidef_Table_5.png)
![HiDef png [114 KiB]](Directory_LHCb-PAPER-2012-041/hidef_Table_6.png)
Supplementary Material [file]
|
This ZIP file contains supplemetary material for the publication LHCb-PAPER-2012-041. The files are: LHCb-PAPER-2012-041-Supplementary.pdf : Description of and results from cross-check analyses. Table_*_XSec.hepdata.txt : Flat text files of the tables of differential cross-sections in LHCb-PAPER-2012-041. These are formatted to ease importing the measurements into the Reactions Database of the Durham HepData Project. |
LHCb-P[..].pdf [153 KiB] HiDef png [292 KiB] Thumbnail [118 KiB] *C file |

|
![HiDef png [292 KiB]](Directory_LHCb-PAPER-2012-041/supplementary/hidef_LHCb-PAPER-2012-041-Supplementary.png)
Created on 27 April 2024.