Study of $B^{0} \rightarrow D^{*-}\pi^{+}\pi^{-}\pi^{+}$ and $B^{0} \rightarrow D^{*-}K^{+}\pi^{-}\pi^{+}$ decays
[to restricted-access page]Information
LHCb-PAPER-2012-046
CERN-PH-EP-2013-041
arXiv:1303.6861 [PDF]
(Submitted on 27 Mar 2013)
Phys. Rev. D87 (2013) 092001
Inspire 1225663
Tools
Abstract
Using proton-proton collision data collected by the LHCb experiment at sqrt(s) = 7 TeV, corresponding to an integrated luminosity of 1.0 fb^{-1}, the ratio of branching fractions of the B0 -> D*- pi+ pi- pi+ decay relative to the B0 -> D*- pi+ decay is measured to be B(B0 -> D*- pi+ pi- pi+) / B(B0 -> D*- pi+) = 2.64 \pm 0.04 (stat.) \pm 0.13 (syst.). The Cabibbo-suppressed decay B0 -> D*- K+ pi- pi+ is observed for the first time and the measured ratio of branching fractions is B(B0 -> D*- K+ pi- pi+) / B(B0 -> D*- pi+ pi- pi+) = (6.47 \pm 0.37 (stat.) \pm 0.35 (syst.)) x 10^{-2}. A search for orbital excitations of charm mesons contributing to the B0 -> D*- pi+ pi- pi+ final state is also performed, and the first observation of the B0 -> Dbar_{1}(2420)^0 pi+ pi- decay is reported with the ratio of branching fractions B(B0 -> (Dbar_{1}(2420)^0 -> D*- pi+) pi- pi+) / B(B0 -> D*- pi+ pi- pi+) = (2.04 \pm 0.42 (stat.) \pm 0.22 (syst.)) x 10^{-2}, where the numerator represents a product of the branching fractions B(B0 -> Dbar_{1}(2420)^0 pi- pi+) and B(Dbar_{1}(2420)^0 -> D*- pi+).
Figures and captions
|
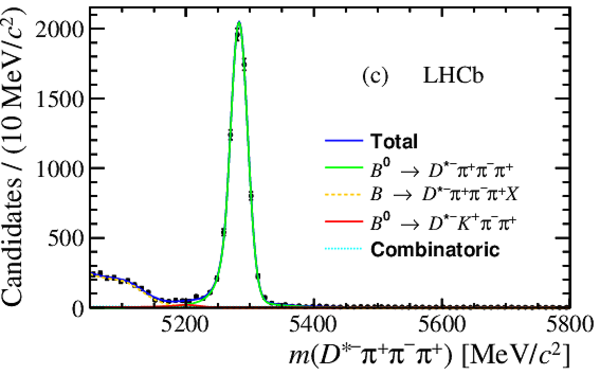
Invariant mass distributions of selected (a) $B^{0} \rightarrow D^{*-} K^{+} \pi^{-} \pi^{+}$, (b) $B^{0} \rightarrow D^{*-} K^{+}$, (c) $B^{0} \rightarrow D^{*-} \pi^{+}\pi^{-}\pi^{+}$ and (d) $B^{0} \rightarrow D^{*-} \pi^{+}$ candidates. Green (red) solid lines represent the CF (CS) signal shapes and their respective particle misidentification backgrounds. Orange dashed lines at low invariant mass represent backgrounds from partially reconstructed decays. Cyan dotted lines represent combinatorial backgrounds. The pink dash-dotted line below the signal peak in the fit to $B^{0}\rightarrow D^{*-}K^{+}\pi^{-}\pi^{+}$ candidates represents the background from misidentified $B^{0}\rightarrow D^{*-}D_{s}^{+}$ and $B^{0}\rightarrow D^{*-}K^{+}\overline{ K }{} ^{*0} $ decays. |
DstKPi[..].pdf [23 KiB] HiDef png [284 KiB] Thumbnail [227 KiB] *.C file |

|
|
DstK_l[..].pdf [21 KiB] HiDef png [235 KiB] Thumbnail [185 KiB] *.C file |

|
|
|
DstPiP[..].pdf [21 KiB] HiDef png [229 KiB] Thumbnail [186 KiB] *.C file |
|
|
|
DstPi_[..].pdf [20 KiB] HiDef png [214 KiB] Thumbnail [168 KiB] *.C file |

|
|
|
Corrected mass $M(D^{*-}\pi^{+}) = m( D ^{*-} \pi ^+ )-m( D ^{*-} )+m( D ^{*-} )_{\text{PDG}} {\mathrm{ Me V /}c^2} $ distribution from background-subtracted $B^{0}\rightarrow D^{*-}\pi^{+}\pi^{-}\pi^{+}$ candidates. The red solid line represents the contribution from $\overline{ D }{} _1(2420)^0$, the red dashed lines represent contributions from the higher excited charm states $D^*_2(2460)^0$, $D(2550)^{0}$, $D(2600)$ and $D(2750)$, which are expected to be present [22] but are not significant in this dataset. The blue dashed line represents $B^{0}$ decays that have not passed through an excited charm resonance. |
Dstars[..].pdf [19 KiB] HiDef png [249 KiB] Thumbnail [185 KiB] *.C file |

|
|
Animated gif made out of all figures. |
PAPER-2012-046.gif Thumbnail |

|
![HiDef png [284 KiB]](Directory_LHCb-PAPER-2012-046/hidef_DstKPiPi_linFit_25_3_13.png)
![HiDef png [235 KiB]](Directory_LHCb-PAPER-2012-046/hidef_DstK_linFit_26_3_13.png)
![HiDef png [229 KiB]](Directory_LHCb-PAPER-2012-046/hidef_DstPiPiPi_linFit_25_3_13.png)
![HiDef png [214 KiB]](Directory_LHCb-PAPER-2012-046/hidef_DstPi_linFit_26_3_13.png)
![HiDef png [249 KiB]](Directory_LHCb-PAPER-2012-046/hidef_Dstarstar_23_3_13.png)
Tables and captions
|
Selected candidate yields from fits to data that are used in the branching fraction calculations. The yield for a decay is given by the sum of the signal shape yield in the CF (CS) fit and the corresponding misidentification background yield in the CS (CF) fit. Uncertainties quoted are statistical only. |
Table_1.pdf [43 KiB] HiDef png [52 KiB] Thumbnail [25 KiB] tex code |

|
|
Kinematic efficiencies, trigger pass fractions and their product, taken from simulation. Quoted uncertainties come from the use of finite size samples to determine efficiencies and are accounted for as a source of systematic uncertainty. |
Table_2.pdf [45 KiB] HiDef png [50 KiB] Thumbnail [23 KiB] tex code |

|
|
Contributions to the relative systematic uncertainty for all measurements. The total uncertainty is obtained by adding the contibutions from the individual sources in quadrature. |
Table_3.pdf [58 KiB] HiDef png [86 KiB] Thumbnail [41 KiB] tex code |

|
![HiDef png [52 KiB]](Directory_LHCb-PAPER-2012-046/hidef_Table_1.png)
![HiDef png [50 KiB]](Directory_LHCb-PAPER-2012-046/hidef_Table_2.png)
![HiDef png [86 KiB]](Directory_LHCb-PAPER-2012-046/hidef_Table_3.png)
Created on 02 May 2024.