Measurements of the branching fractions of $B^{+} \to p \bar{p} K^{+}$ decays
[to restricted-access page]Information
LHCb-PAPER-2012-047
CERN-PH-EP-2013-040
arXiv:1303.7133 [PDF]
(Submitted on 28 Mar 2013)
Eur. Phys. J. C73 (2013) 2462
Inspire 1225787
Tools
Abstract
The branching fractions of the decay $B^{+} \to p \bar p K^{+}$ for different intermediate states are measured using data, corresponding to an integrated luminosity of $1.0 fb^{-1}$, collected by the LHCb experiment. The total branching fraction, its charmless component $(M_{p\bar p} <2.85 {GeV/}c^{2})$ and the branching fractions via the resonant $c\bar c$ states $\eta_{c}(1S)$ and $\psi(2S)$ relative to the decay via a $J/\psi$ intermediate state are {align*} \frac{{\mathcal B}(B^{+} \to p \bar p K^{+})_{total}}{{\mathcal B}(B^{+} \to J/\psi K^{+} \to p \bar p K^{+})}=& 4.91 \pm 0.19 {(\rm stat)} \pm 0.14 {(\rm syst)}, \frac{{\mathcal B}(B^{+} \to p \bar p K^{+})_{M_{p\bar p} <2.85 {GeV/}c^{2}}}{{\mathcal B}(B^{+} \to J/\psi K^{+} \to p \bar p K^{+})}=& 2.02 \pm 0.10 {(\rm stat)}\pm 0.08 {(\rm syst)}, \frac{{\mathcal B} (B^{+} \to \eta_{c}(1S) K^{+} \to p \bar p K^{+})}{{\mathcal B}(B^{+} \to J/\psi K^{+} \to p \bar p K^{+})} = & 0.578 \pm 0.035 {(\rm stat)} \pm 0.027 {(\rm syst)}, \frac{{\mathcal B} (B^{+} \to \psi(2S) K^{+} \to p \bar p K^{+})}{{\mathcal B}(B^{+} \to J/\psi K^{+} \to p \bar p K^{+})}=& 0.080 \pm 0.012 {(\rm stat)} \pm 0.009 {(\rm syst)}. {align*} Upper limits on the $B^{+}$ branching fractions into the $\eta_{c}(2S)$ meson and into the charmonium-like states X(3872) and X(3915) are also obtained.
Figures and captions
|
Distribution of the BDT algorithm response evaluated for background candidates from the data sidebands (red), and signal candidates from simulation (blue). The black dotted line indicates the chosen BDT response value. |
bdtpaper.pdf [14 KiB] HiDef png [366 KiB] Thumbnail [260 KiB] *.C file |

|
|
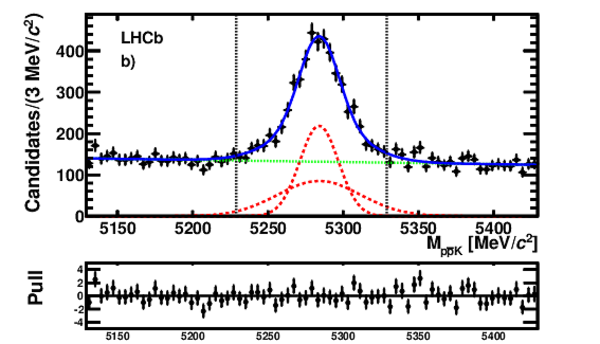
Invariant mass distribution of a) all selected $B^{+} \rightarrow p \bar p K^{+}$ candidates and b) candidates having $M_{p \bar p} < 2.85 {\rm{GeV/}}c^{2}$. The points with error bars are the data and the solid lines are the result of the fit. The dotted lines represent the two Gaussian functions (red) and the dashed line the linear function (green) used to parametrize the signal and the background, respectively. The vertical lines indicate the signal region. The two plots below the mass distributions show the pulls. |
all.pdf [18 KiB] HiDef png [232 KiB] Thumbnail [211 KiB] *.C file |

|
|
285.pdf [18 KiB] HiDef png [239 KiB] Thumbnail [220 KiB] *.C file |
|
|
|
Invariant mass distribution of the $p \bar p$ system for $B^{+} \rightarrow p\bar p K^{+}$ candidates within the $B^{+}$ mass signal window, $\vert M(p\bar p K^{+}) - M_{B^+}\vert < 50 {\rm{MeV/}}c^{2}$. The dotted lines represent the Gaussian and Voigtian functions (red) and the dashed line the smooth function (green) used to parametrize the signal and the background, respectively. The bottom plot shows the pulls. |
ppall.pdf [22 KiB] HiDef png [234 KiB] Thumbnail [198 KiB] *.C file |

|
|
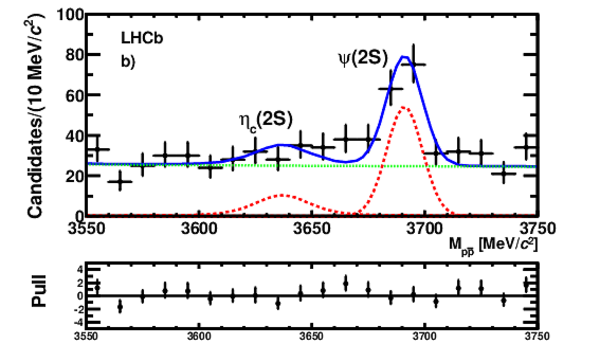
Invariant mass distribution of the $p \bar p$ system in the regions around a) the $\eta_{c}(1S)$ and $J/\psi$ and b) the $\eta_{c}(2S)$ and $\psi(2S)$ states. The dotted lines represent the Gaussian and the Voigtian functions (red) and the dashed line the smooth function (green) used to parametrize the signal and the background, respectively. The two plots below the mass distribution show the pulls. |
jpsi.pdf [38 KiB] HiDef png [223 KiB] Thumbnail [184 KiB] *.C file |

|
|
etac2s.pdf [51 KiB] HiDef png [197 KiB] Thumbnail [179 KiB] *.C file |
|
|
|
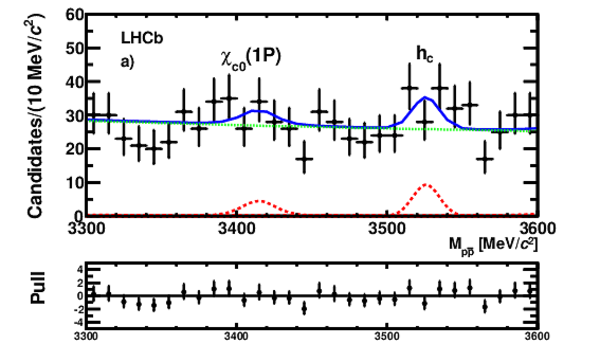
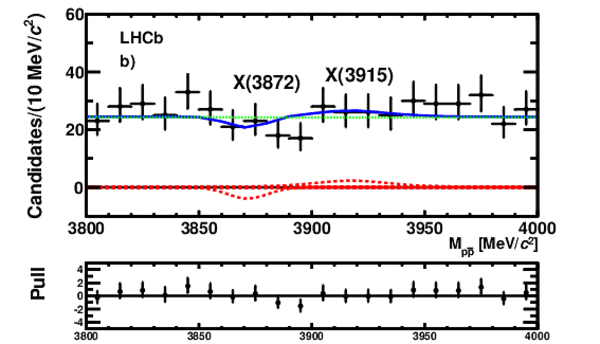
Invariant mass distribution of the $p \bar p$ system in the regions around a) the $\chi_{c0}(1P)$ and $h_{c}$ and b) the $X(3872)$ and $X(3915)$ states. The dotted lines represent the Gaussian and Voigitian functions (red) and the dashed line the smooth function (green) used to parametrize the signal and the background, respectively. The two plots below the mass distribution show the pulls. |
chic0.pdf [35 KiB] HiDef png [191 KiB] Thumbnail [179 KiB] *.C file |
|
|
x.pdf [23 KiB] HiDef png [191 KiB] Thumbnail [169 KiB] *.C file |
|
|
|
Efficiency as a function of $M_{p \bar p}$ for $B^{+} \rightarrow p \bar p K^{+}$ decays. The solid line represents the linear fit to the efficiency distribution; the dashed line is the point-by-point interpolation used to estimate the systematic uncertainty. |
eff.pdf [20 KiB] HiDef png [92 KiB] Thumbnail [54 KiB] *.C file |

|
|
Animated gif made out of all figures. |
PAPER-2012-047.gif Thumbnail |

|
![HiDef png [366 KiB]](Directory_LHCb-PAPER-2012-047/hidef_bdtpaper.png)
![HiDef png [232 KiB]](Directory_LHCb-PAPER-2012-047/hidef_all.png)
![HiDef png [239 KiB]](Directory_LHCb-PAPER-2012-047/hidef_285.png)
![HiDef png [234 KiB]](Directory_LHCb-PAPER-2012-047/hidef_ppall.png)
![HiDef png [223 KiB]](Directory_LHCb-PAPER-2012-047/hidef_jpsi.png)
![HiDef png [197 KiB]](Directory_LHCb-PAPER-2012-047/hidef_etac2s.png)
![HiDef png [191 KiB]](Directory_LHCb-PAPER-2012-047/hidef_chic0.png)
![HiDef png [191 KiB]](Directory_LHCb-PAPER-2012-047/hidef_x.png)
![HiDef png [92 KiB]](Directory_LHCb-PAPER-2012-047/hidef_eff.png)
Tables and captions
|
Signal yields for the different channels and corresponding 95% {\rm{CL}} upper limits for modes with less than 3$\sigma$ statistical significance. For the $J/\psi$ mode, the non-signal yield is subtracted. Uncertainties are statistical only. |
Table_1.pdf [50 KiB] HiDef png [37 KiB] Thumbnail [15 KiB] tex code |

|
|
Relative systematic uncertainties (in $\%$) on the relative branching fractions from different sources. The total systematic uncertainty is determined by adding the individual contributions in quadrature. |
Table_2.pdf [50 KiB] HiDef png [57 KiB] Thumbnail [24 KiB] tex code |

|
|
Signal yields, efficiency ratios, ratios of branching fractions and corresponding upper limits. |
Table_3.pdf [79 KiB] HiDef png [63 KiB] Thumbnail [25 KiB] tex code |

|
|
Branching fractions for $B^{+}\rightarrow ({\rm mode})\rightarrow p\bar p K^{+}$ derived using the world average value of the ${\cal B}(B^{+}\rightarrow { J \mskip -3mu/\mskip -2mu\psi \mskip 2mu} K^{+})$ and ${\cal B}( { J \mskip -3mu/\mskip -2mu\psi \mskip 2mu} \rightarrow p\bar p)$ branching fractions [16]. For the charmonium modes we compare our values to the product of the indipendently measured branching fractions. The first uncertainties are statistical, the second systematic in the present measurement, and the third systematic from the uncertainty on the $J/\psi$ branching fraction. |
Table_4.pdf [72 KiB] HiDef png [58 KiB] Thumbnail [24 KiB] tex code |

|
![HiDef png [37 KiB]](Directory_LHCb-PAPER-2012-047/hidef_Table_1.png)
![HiDef png [57 KiB]](Directory_LHCb-PAPER-2012-047/hidef_Table_2.png)
![HiDef png [63 KiB]](Directory_LHCb-PAPER-2012-047/hidef_Table_3.png)
![HiDef png [58 KiB]](Directory_LHCb-PAPER-2012-047/hidef_Table_4.png)
Created on 27 April 2024.