Information
LHCb-PAPER-2012-049
CERN-PH-EP-2013-031
arXiv:1303.1092 [PDF]
(Submitted on 05 Mar 2013)
Phys. Rev. Lett. 110 (2013) 211801
Inspire 1222505
Tools
Abstract
\noindent A search for the decays $B^0_{s}\rightarrow \mu^+ \mu^- \mu^+ \mu^-$ and $B^0 \rightarrow \mu^+ \mu^- \mu^+ \mu^-$ is performed using data, corresponding to an integrated luminosity of 1.0 $\{ fb}^{-1}$ , collected with the LHCb detector in 2011. The number of candidates observed is consistent with the expected background and, assuming phase-space models of the decays, limits on the branching fractions are set: \{${\cal B }(B^0_{s}\rightarrow \mu^+ \mu^- \mu^+ \mu^-) < 1.6 \ (1.2) \times 10^{-8}$} and \{${\cal B }(B^0 \rightarrow \mu^+ \mu^- \mu^+ \mu^-)< 6.6 \ (5.3) \times 10^{-9}$} at 95 (90 ) confidence level. In addition, limits are set in the context of a supersymmetric model which allows for the $B^0_{(s)}$ meson to decay into a scalar ($S$) and pseudoscalar particle ($P$), where $S$ and $P$ have masses of 2.5 GeV and 214.3 MeV, respectively, both resonances decay into $\mu^+\mu^-$. The branching fraction limits for these decays are \{${\cal B }( B^0_{s}\rightarrow SP ) < 1.6 \ (1.2) \times 10^{-8}$} and \{${\cal B }( B^0\rightarrow SP )< 6.3 \ (5.1) \times 10^{-9}$} at 95 (90) confidence level.
Figures and captions
|
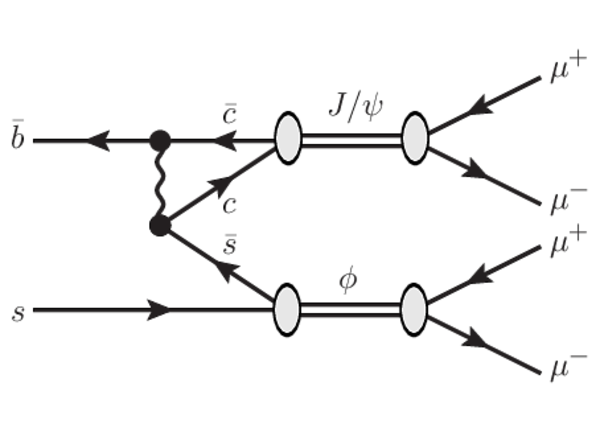
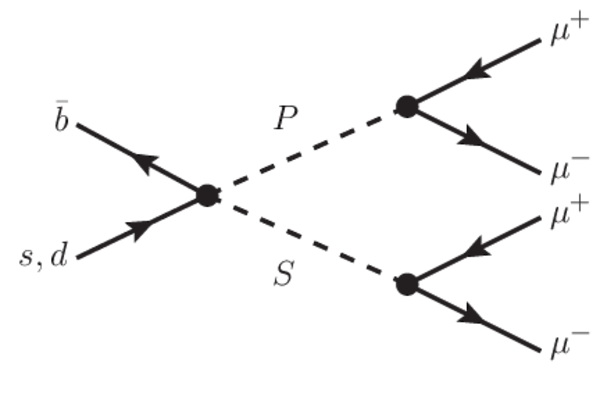
Feynman diagrams for the $ B ^0_\mathrm{s} \to\mu^+\mu^-\mu^+\mu^-$ and $ B ^0 \to\mu^+\mu^-\mu^+\mu^-$ decays, via (a) the resonant $ B ^0_\mathrm{s} \to J/\psi\phi $ SM channel, (b) the nonresonant SM channel and (c) the supersymmetric channel. The latter is propagated by scalar $S$ and pseudoscalar $P$ sgoldstino sfermions. |
SMres.pdf [8 KiB] HiDef png [97 KiB] Thumbnail [115 KiB] *.C file |
|
|
SMnonres.pdf [9 KiB] HiDef png [77 KiB] Thumbnail [88 KiB] *.C file |

|
|
|
MSSM.pdf [7 KiB] HiDef png [35 KiB] Thumbnail [98 KiB] *.C file |
|
|
|
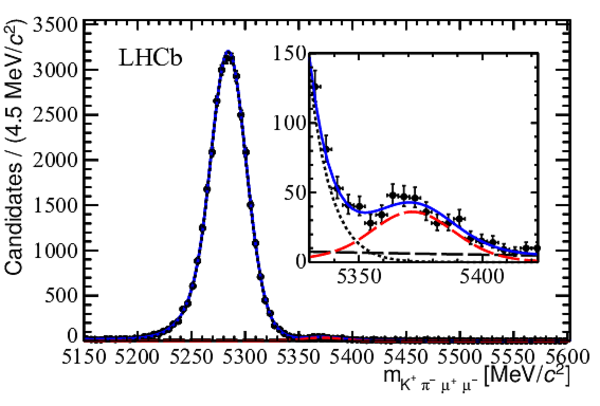
(color online). Invariant mass distribution of $K^+ \pi^- \mu^+ \mu^-$ candidates. The $ B ^0$ and $\overline{ B }{} ^0_\mathrm{s} $ signal distributions are shown by short-dashed black and long-dashed red (gray) lines, respectively. The background shape is denoted by a long-dashed black line. The total fit result is shown as a solid blue (black) line. The inset shows the mass distribution centered around the $\overline{ B }{} ^0_\mathrm{s} $ mass. |
jpsiks[..].pdf [94 KiB] HiDef png [278 KiB] Thumbnail [238 KiB] *.C file |
|
|
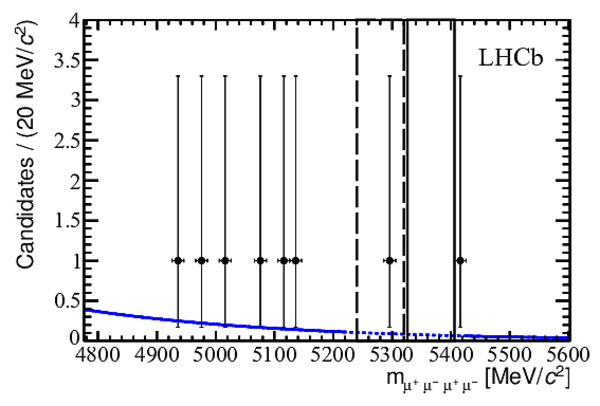
Invariant mass distribution of nonresonant $ B^0_{(s)}\to \mu^+ \mu^- \mu^+ \mu^- $ candidates. The solid (dashed) black lines indicate the boundaries of the $ B ^0_\mathrm{s} $ ( $ B ^0$ ) signal window. The blue curve shows the model used to fit the mass sidebands and extract the expected number of combinatorial background events in the $ B ^0_\mathrm{s} $ and $ B ^0$ signal regions. Only events in the region in which the line is solid have been considered in the fit. |
unblinded.pdf [65 KiB] HiDef png [162 KiB] Thumbnail [141 KiB] *.C file |
|
|
Animated gif made out of all figures. |
PAPER-2012-049.gif Thumbnail |

|
![HiDef png [97 KiB]](Directory_LHCb-PAPER-2012-049/hidef_SMres.png)
![HiDef png [77 KiB]](Directory_LHCb-PAPER-2012-049/hidef_SMnonres.png)
![HiDef png [35 KiB]](Directory_LHCb-PAPER-2012-049/hidef_MSSM.png)
![HiDef png [278 KiB]](Directory_LHCb-PAPER-2012-049/hidef_jpsikstfit_bkg.png)
![HiDef png [162 KiB]](Directory_LHCb-PAPER-2012-049/hidef_unblinded.png)
Tables and captions
|
Combined reconstruction and selection efficiencies of all the decay modes considered in the analysis. The uncertainties shown are statistical. |
Table_1.pdf [47 KiB] HiDef png [153 KiB] Thumbnail [64 KiB] tex code |

|
|
Systematic uncertainties on the branching fractions of $ B^0_{(s)}\to \mu^+ \mu^- \mu^+ \mu^- $ . The combined systematic uncertainties are calculated by adding the individual components in quadrature. |
Table_2.pdf [56 KiB] HiDef png [161 KiB] Thumbnail [66 KiB] tex code |

|
![HiDef png [153 KiB]](Directory_LHCb-PAPER-2012-049/hidef_Table_1.png)
![HiDef png [161 KiB]](Directory_LHCb-PAPER-2012-049/hidef_Table_2.png)
Created on 27 April 2024.