First observations of $\bar{B}_s^0\to D^+D^-$, $D_s^+D^-$ and $D^0\bar{D}^0$ decays
[to restricted-access page]Information
LHCb-PAPER-2012-050
CERN-PH-EP-2013-018
arXiv:1302.5854 [PDF]
(Submitted on 23 Feb 2013)
Phys. Rev. D87 (2013) 092007
Inspire 1221043
Tools
Abstract
First observations and measurements of the branching fractions of the $\bar{B}_s^0\to D^+D^-$, $\bar{B}_s^0\to D_s^+D^-$ and $\bar{B}_s^0\to D^0\bar{D}^0$ decays are presented using 1.0 fb$^{-1}$ of data collected by the LHCb experiment. These branching fractions are normalized to those of $\bar{B}^0\to D^+D^-$, $B^0\to D_s^+D^-$ and $B^-\to D^0D_s^-$, respectively. An excess of events consistent with the decay $\bar{B}^0\to D^0\bar{D}^0$ is also seen, and its branching fraction is measured relative to that of $B^-\to D^0D_s^-$. Improved measurements of the branching fractions ${\cal{B}}(\bar{B}_s^0\to D_s^+D_s^-)$ and ${\cal{B}}(B^-\to D^0D_s^-)$ are reported, each relative to ${\cal{B}}(B^0\to D_s^+D^-)$. The ratios of branching fractions are {-0.2in} {center} {align*} {{\cal{B}}(\bar{B}_s^0\to D^+D^-)\over {\cal{B}}(\bar{B}^0\to D^+D^-)} &= 1.08\pm 0.20\pm0.10, {{\cal{B}}(\bar{B}_s^0\to D_s^+D^-)\over {\cal{B}}(B^0\to D_s^+D^-)} &= 0.050\pm 0.008\pm0.004, {{\cal{B}}(\bar{B}_s^0\to D^0\bar{D}^0)\over {\cal{B}}(B^-\to D^0D_s^-)} &= 0.019\pm 0.003\pm0.003, {{\cal{B}}(\bar{B}^0\to D^0\bar{D}^0)\over {\cal{B}}(B^-\to D^0D_s^-)} &= 0.0014\pm 0.0006\pm0.0002,{{\cal{B}}(\bar{B}_s^0\to D_s^+D_s^-)\over {\cal{B}}(B^0\to D_s^+D^-)} &= 0.56\pm 0.03\pm0.04, {{\cal{B}}(B^-\to D^0D_s^-)\over {\cal{B}}(B^0\to D_s^+D^-)} &= 1.22\pm 0.02\pm0.07, {align*} {center} \noindent where the uncertainties are statistical and systematic, respectively.
Figures and captions
|
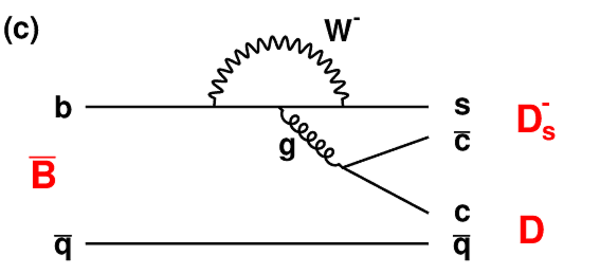
Feynman diagrams contributing to the double-charm final states discussed in this paper. They include (a) tree, (b) $W$-exchange and (c) penguin diagrams. |
TreeB2DD.pdf [13 KiB] HiDef png [49 KiB] Thumbnail [44 KiB] *.C file |

|
|
Exchan[..].pdf [16 KiB] HiDef png [67 KiB] Thumbnail [64 KiB] *.C file |

|
|
|
PengB2DD.pdf [17 KiB] HiDef png [63 KiB] Thumbnail [60 KiB] *.C file |
|
|
|
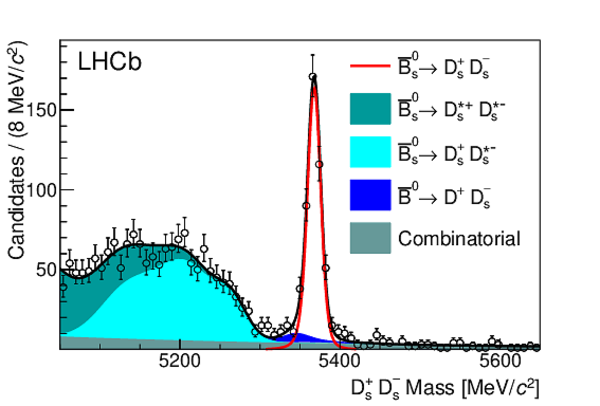
Invariant mass distributions for (left) $\overline{ B }{} ^0_ s \rightarrow D ^+_ s D ^-_ s $ and (right) $ B ^0 \rightarrow D ^+_ s D ^- $ candidates in the data with the loose BDT selection applied to the latter. The signal and background components are indicated in the legend. The $\Lambda_b^0\rightarrow \Lambda _ c ^+ D ^-_ s $, $\overline{ B }{} ^0_ s \rightarrow D ^+_ s K ^- K ^+ \pi ^- $ and $ B ^0 \rightarrow D ^- K ^+ K ^- \pi ^+ $ background components are too small to be seen, and are excluded from the legends. |
B2DsDs[..].pdf [26 KiB] HiDef png [249 KiB] Thumbnail [183 KiB] *.C file |
|
|
B2DsDF[..].pdf [27 KiB] HiDef png [214 KiB] Thumbnail [153 KiB] *.C file |

|
|
|
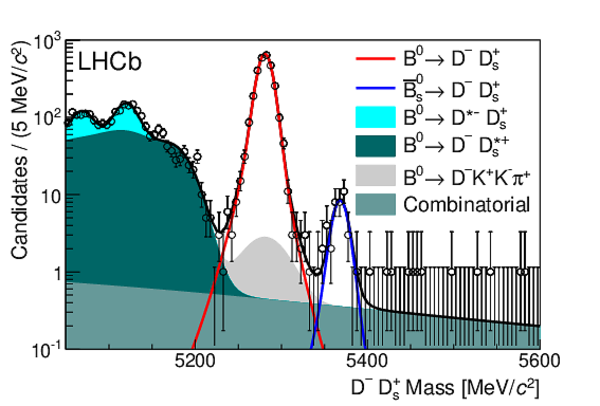
Invariant mass distribution for $ B ^0 \rightarrow D ^+_ s D ^- $ and $\overline{ B }{} ^0_ s \rightarrow D ^+_ s D ^- $ candidates in the data, with the tight BDT selection applied. The distribution is plotted on a (left) linear and (right) logarithmic scale to highlight the suppressed $\overline{ B }{} ^0_ s \rightarrow D ^+_ s D ^- $ signal. Signal and background components are indicated in the legend. |
B2DsDF[..].pdf [26 KiB] HiDef png [214 KiB] Thumbnail [159 KiB] *.C file |

|
|
B2DsDF[..].pdf [30 KiB] HiDef png [313 KiB] Thumbnail [231 KiB] *.C file |
|
|
|
Invariant mass distributions for (left) $\overline{ B }{} ^0 _{(s)}\rightarrow D ^+ D ^- $ and (right) $\overline{ B }{} ^0 _{(s)}\rightarrow D ^0 \overline{ D }{} ^0 $ candidates in the data. Signal and background components are indicated in the legend. |
B2DDFi[..].pdf [26 KiB] HiDef png [215 KiB] Thumbnail [161 KiB] *.C file |

|
|
B2D0D0[..].pdf [28 KiB] HiDef png [274 KiB] Thumbnail [205 KiB] *.C file |

|
|
|
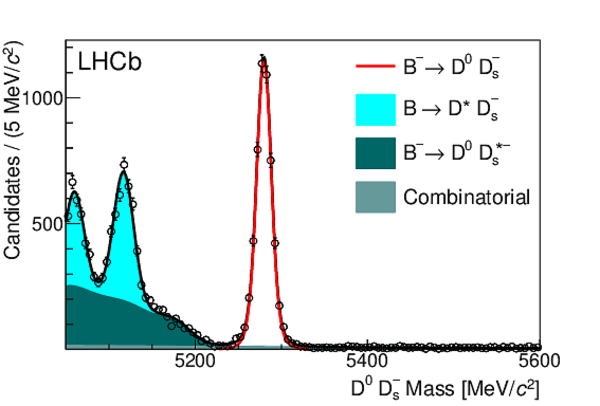
Invariant mass distribution for $ B ^- \rightarrow D ^0 D ^-_ s $ candidates in the data. Signal and background components are indicated in the legend. The $ B ^- \rightarrow D ^0 K ^- K ^+ \pi ^- $ background components are too small to be seen, and are excluded from the legend. |
B2D0Ds[..].pdf [26 KiB] HiDef png [220 KiB] Thumbnail [156 KiB] *.C file |
|
|
Animated gif made out of all figures. |
PAPER-2012-050.gif Thumbnail |

|
![HiDef png [49 KiB]](Directory_LHCb-PAPER-2012-050/hidef_TreeB2DD.png)
![HiDef png [67 KiB]](Directory_LHCb-PAPER-2012-050/hidef_ExchangeB2DD.png)
![HiDef png [63 KiB]](Directory_LHCb-PAPER-2012-050/hidef_PengB2DD.png)
![HiDef png [249 KiB]](Directory_LHCb-PAPER-2012-050/hidef_B2DsDsFit_nominal_wfdchi2cut.png)
![HiDef png [214 KiB]](Directory_LHCb-PAPER-2012-050/hidef_B2DsDFitLoose_nominal_wfdchi2cut.png)
![HiDef png [214 KiB]](Directory_LHCb-PAPER-2012-050/hidef_B2DsDFit_nominal_wfdchi2cut.png)
![HiDef png [313 KiB]](Directory_LHCb-PAPER-2012-050/hidef_B2DsDFitLog_nominal_wfdchi2cut.png)
![HiDef png [215 KiB]](Directory_LHCb-PAPER-2012-050/hidef_B2DDFit_nominal_wfdchi2cut.png)
![HiDef png [274 KiB]](Directory_LHCb-PAPER-2012-050/hidef_B2D0D0Fit_nominal_wfdchi2cut.png)
![HiDef png [220 KiB]](Directory_LHCb-PAPER-2012-050/hidef_B2D0DsFit_nominal_wfdchi2cut.png)
Tables and captions
|
Individual contributions to the efficiency for selecting the various $B\rightarrow D\overline{ D }{} ^{\prime}$ final states. Shown are the efficiencies to reconstruct and trigger on the final state, and to pass the charm cross-feed veto, the VS $\chi^2$ and BDT selection requirements. The total selection efficiency is the product of these four values. The relative uncertainty on the selection efficiency for each decay mode due to the finite simulation samples sizes is 2%. Entries with a dash indicate that the efficiency factor is not applicable. |
Table_1.pdf [54 KiB] HiDef png [47 KiB] Thumbnail [21 KiB] tex code |

|
|
Summary of the observed signal and normalization mode yields and their relative efficiencies, as used in the measurements of the ratios of branching fractions. The quoted uncertainties are statistical only. |
Table_2.pdf [61 KiB] HiDef png [102 KiB] Thumbnail [52 KiB] tex code |

|
|
Sources of systematic uncertainty and their values (in %) for the ratios of branching fractions of the indicated decays. For $\cal{B}(\overline{ B }{} ^0 _{(s)}\rightarrow D ^0 \overline{ D }{} ^0 )/\cal{B}( B ^- \rightarrow D ^0 D ^-_ s )$, the error on $f_d/f_s$ only applies to the $\overline{ B }{} ^0_ s \rightarrow D ^0 \overline{ D }{} ^0 $ decay, as indicated by the values in parentheses. |
Table_3.pdf [69 KiB] HiDef png [64 KiB] Thumbnail [29 KiB] tex code |

|
![HiDef png [47 KiB]](Directory_LHCb-PAPER-2012-050/hidef_Table_1.png)
![HiDef png [102 KiB]](Directory_LHCb-PAPER-2012-050/hidef_Table_2.png)
![HiDef png [64 KiB]](Directory_LHCb-PAPER-2012-050/hidef_Table_3.png)
Created on 02 May 2024.