Search for $D^{+}_{(s)} \rightarrow \pi^{+} \mu^{+} \mu^{-}$ and $D^{+}_{(s)} \rightarrow \pi^{-} \mu^{+} \mu^{+}$ decays
[to restricted-access page]Information
LHCb-PAPER-2012-051
CERN-PH-EP-2013-061
arXiv:1304.6365 [PDF]
(Submitted on 23 Apr 2013)
Phys. Lett. B724 (2013) 203
Inspire 1229506
Tools
Abstract
A search for non-resonant D+(s) to pi+mu+mu- and D+(s) to pi-mu+mu+ decays is performed using proton-proton collision data, corresponding to an integrated luminosity of 1.0 fb-1, at sqrt(s) = 7 TeV recorded by the LHCb experiment in 2011. No signals are observed and the 90 (95) confidence level (CL) limits on the branching fractions are B(D+ to pi+mu+mu-) < 7.3 (8.3) x 10-8, B(Ds+ to pi+mu+mu-) < 4.1 (4.8) x 10-7, B(D+ to pi-mu+mu+) < 2.2 (2.5) x 10-8, B(Ds+ to pi-mu+mu+) < 1.2 (1.4) x 10-7. These limits are the most stringent to date.
Figures and captions
|
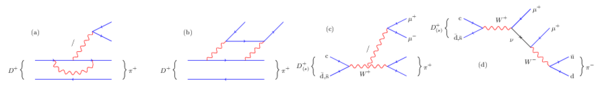
Feynman diagrams for (a,b) the FCNC decay $ D ^+ \rightarrow \pi ^+ \mu ^+\mu ^- $ , (c) the weak annihilation of a $ D ^+ _{( s )}$ meson and (d) a possible LNV $ D ^+ _{( s )}$ meson decay mediated by a Majorana neutrino. |
Fig_1.pdf [47 KiB] HiDef png [36 KiB] Thumbnail [18 KiB] *.C file tex code |
|
|
Invariant mass distributions for $ D ^+ _{( s )} \rightarrow \pi ^+ \mu ^+\mu ^- $ candidates in the five $m(\mu ^+\mu ^- )$ bins. Shown are the (a) low- $ m(\mu ^+\mu ^- )$ , (b) $\eta$ , (c) $\rho$ / $\omega$ , (d) $\phi$ (including trigger lines with $ m(\mu ^+\mu ^- ) >1.0 {\mathrm{ Ge V /}c^2} $), and (e) high- $ m(\mu ^+\mu ^- )$ regions. The data are shown as points (black) and the total PDF (dark blue line) is overlaid. The components of the fit are also shown: the signal (light green line), the peaking background (solid area) and the non-peaking background (dashed line). |
plots_[..].pdf [19 KiB] HiDef png [230 KiB] Thumbnail [188 KiB] *.C file |
|
|
plots_[..].pdf [21 KiB] HiDef png [280 KiB] Thumbnail [201 KiB] *.C file |

|
|
|
plots_[..].pdf [21 KiB] HiDef png [340 KiB] Thumbnail [231 KiB] *.C file |
|
|
|
plots_[..].pdf [22 KiB] HiDef png [279 KiB] Thumbnail [183 KiB] *.C file |

|
|
|
plots_[..].pdf [21 KiB] HiDef png [299 KiB] Thumbnail [220 KiB] *.C file |
|
|
|
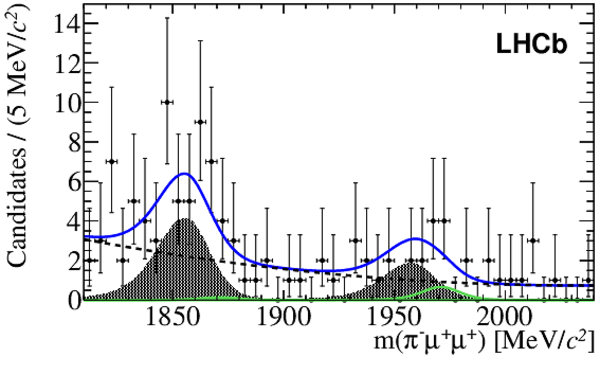
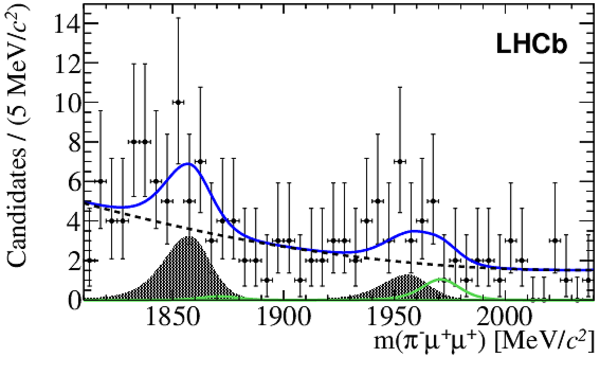
Invariant mass distributions for $ D ^+ _{( s )} \rightarrow \pi ^- \mu ^+ \mu ^+ $ in the four $m(\pi ^- \mu ^+ )$ regions. Shown are (a) bin 1, (b) bin 2, (c) bin 3, and (d) bin 4. The data are shown as black points and the total PDF (dark blue line) is overlaid. The components of the fit are also shown: the signal (light green line), the peaking background (solid area) and the non-peaking background (dashed line). |
plots_[..].pdf [21 KiB] HiDef png [301 KiB] Thumbnail [220 KiB] *.C file |
|
|
plots_[..].pdf [21 KiB] HiDef png [277 KiB] Thumbnail [214 KiB] *.C file |
|
|
|
plots_[..].pdf [21 KiB] HiDef png [289 KiB] Thumbnail [218 KiB] *.C file |

|
|
|
plots_[..].pdf [20 KiB] HiDef png [246 KiB] Thumbnail [189 KiB] *.C file |

|
|
|
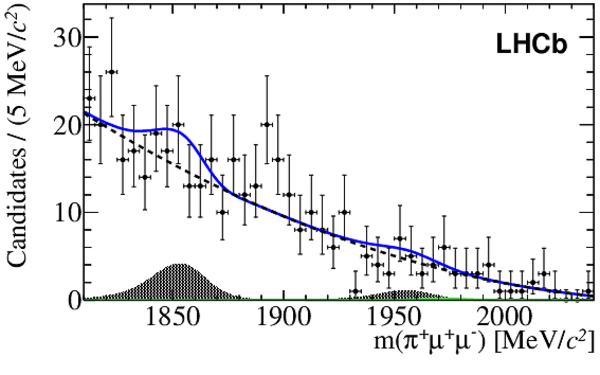
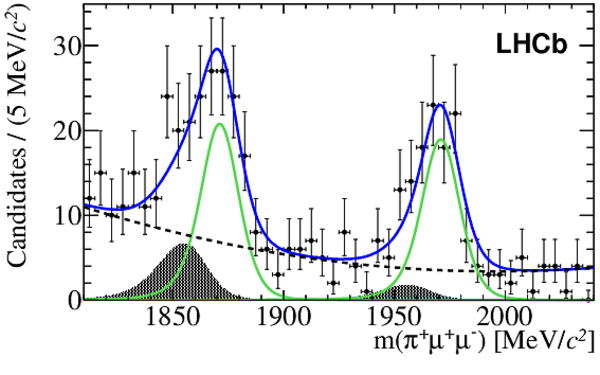
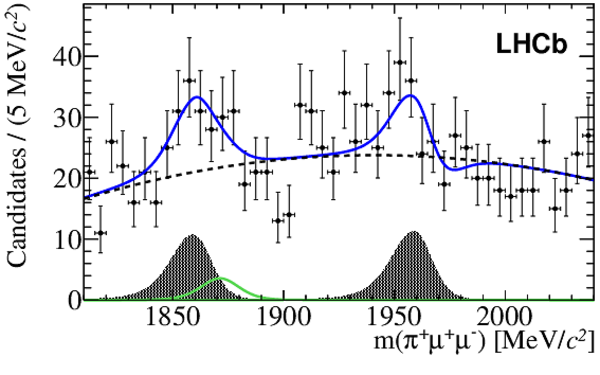
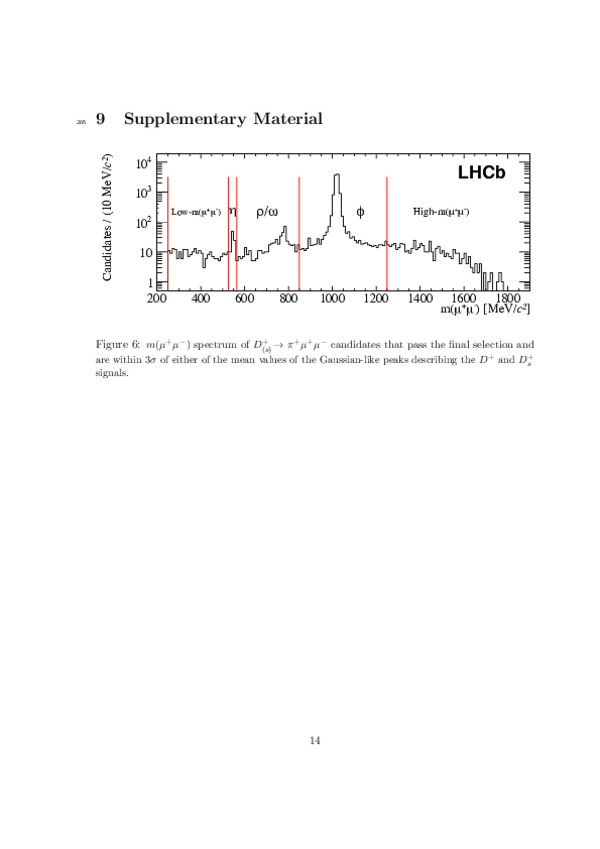
Background-subtracted m( $\mu ^+\mu ^-$ ) spectrum of (a) $ D ^+ \rightarrow \pi ^+ \mu ^+\mu ^- $ and (b) $ D ^+_ s \rightarrow \pi ^+ \mu ^+\mu ^- $ candidates that pass the final selection. The inset shows the $\phi$ contribution, and the main figure shows the $\eta$ and the $\rho$ / $\omega$ contributions. The non-peaking structure of the low and high- $ m(\mu ^+\mu ^- )$ regions is also visible. |
Dd_mMu[..].pdf [25 KiB] HiDef png [134 KiB] Thumbnail [70 KiB] *.C file |

|
|
Ds_mMu[..].pdf [25 KiB] HiDef png [135 KiB] Thumbnail [70 KiB] *.C file |

|
|
|
Observed (solid curve) and expected (dashed curve) $\mathrm{CL}_{s}$ values as a function of $\cal B$ ( $ D ^+ \rightarrow \pi ^+ \mu ^+\mu ^- $ ). The green (yellow) shaded area contains the $\pm1\sigma$ ($\pm2\sigma$) interval of possible results compatible with the expected value if only background is observed. The upper limits at the 90% (95%) $\mathrm{CL}$ are indicated by the dashed (solid) line. |
LimitC[..].pdf [13 KiB] HiDef png [189 KiB] Thumbnail [148 KiB] *.C file |

|
|
Animated gif made out of all figures. |
PAPER-2012-051.gif Thumbnail |

|
![HiDef png [36 KiB]](Directory_LHCb-PAPER-2012-051/hidef_Fig_1.png)
![HiDef png [230 KiB]](Directory_LHCb-PAPER-2012-051/hidef_plots_canvas_low.png)
![HiDef png [280 KiB]](Directory_LHCb-PAPER-2012-051/hidef_plots_canvas_eta.png)
![HiDef png [340 KiB]](Directory_LHCb-PAPER-2012-051/hidef_plots_canvas_rho.png)
![HiDef png [279 KiB]](Directory_LHCb-PAPER-2012-051/hidef_plots_canvas_phi_hi.png)
![HiDef png [299 KiB]](Directory_LHCb-PAPER-2012-051/hidef_plots_canvas_hi.png)
![HiDef png [301 KiB]](Directory_LHCb-PAPER-2012-051/hidef_plots_canvas_ssbin1.png)
![HiDef png [277 KiB]](Directory_LHCb-PAPER-2012-051/hidef_plots_canvas_ssbin2.png)
![HiDef png [289 KiB]](Directory_LHCb-PAPER-2012-051/hidef_plots_canvas_ssbin3.png)
![HiDef png [246 KiB]](Directory_LHCb-PAPER-2012-051/hidef_plots_canvas_ssbin4.png)
![HiDef png [134 KiB]](Directory_LHCb-PAPER-2012-051/hidef_Dd_mMuMu_sPlot.png)
![HiDef png [135 KiB]](Directory_LHCb-PAPER-2012-051/hidef_Ds_mMuMu_sPlot.png)
![HiDef png [189 KiB]](Directory_LHCb-PAPER-2012-051/hidef_LimitCalculator_Banana_BF_Dd_himumu_pion.png)
Tables and captions
|
Signal yields for the $ D ^+ _{( s )} \rightarrow \pi ^+ \mu ^+\mu ^- $ fits. The $\phi$ region yields differ due to the different trigger conditions. |
Table_1.pdf [52 KiB] HiDef png [45 KiB] Thumbnail [20 KiB] tex code |

|
|
Signal yields for the $ D ^+ _{( s )} \rightarrow \pi ^- \mu ^+ \mu ^+ $ fit. The $\phi$ region from the $ D ^+ _{( s )} \rightarrow \pi ^+ \mu ^+\mu ^- $ channel is used for normalisation. The particle '$x$' is a $\pi $ when referring to $ D ^+ _{( s )} \rightarrow \pi ^- \mu ^+ \mu ^+ $ data and a $\mu $ for $ D ^+ _{( s )} \rightarrow \pi ^+ \mu ^+\mu ^- $ data. |
Table_2.pdf [50 KiB] HiDef png [40 KiB] Thumbnail [20 KiB] tex code |

|
|
Relative systematic uncertainties averaged over all bins and decay modes for the control mode branching fraction and efficiency ratio. The number in parentheses refers to the $ D ^+_ s $ decay. |
Table_3.pdf [51 KiB] HiDef png [49 KiB] Thumbnail [22 KiB] tex code |

|
|
Total systematic uncertainty in each $ m(\mu ^+\mu ^- )$ and $ m(\pi ^- \mu ^+ )$ bin with the uncertainty on the control mode branching fraction, the efficiency ratio and the statistical uncertainty stemming from the size of the simulated samples added in quadrature. The numbers in parentheses refer to the $ D ^+_ s $ decay. |
Table_4.pdf [50 KiB] HiDef png [38 KiB] Thumbnail [20 KiB] tex code |

|
|
Upper limits in each $ m(\mu ^+\mu ^- )$ and $ m(\pi ^- \mu ^+ )$ bin and total branching fractions at the 90% and 95% $\mathrm{CL}$ and p-values for the background-only hypothesis. |
Table_5.pdf [51 KiB] HiDef png [76 KiB] Thumbnail [36 KiB] tex code |

|
![HiDef png [45 KiB]](Directory_LHCb-PAPER-2012-051/hidef_Table_1.png)
![HiDef png [40 KiB]](Directory_LHCb-PAPER-2012-051/hidef_Table_2.png)
![HiDef png [49 KiB]](Directory_LHCb-PAPER-2012-051/hidef_Table_3.png)
![HiDef png [38 KiB]](Directory_LHCb-PAPER-2012-051/hidef_Table_4.png)
![HiDef png [76 KiB]](Directory_LHCb-PAPER-2012-051/hidef_Table_5.png)
Supplementary Material [file]
| Supplementary material full pdf |
supple[..].pdf [116 KiB] |
|
|
This ZIP file contains supplemetary material for the publication LHCb-PAPER-2012-051. The files are: supplementary.pdf : An overview of the extra figures *.pdf, *.png, *.eps : The figures in various formats |
Dimuon[..].pdf [15 KiB] HiDef png [125 KiB] Thumbnail [120 KiB] *C file |

|
![HiDef png [125 KiB]](Directory_LHCb-PAPER-2012-051/supplementary/hidef_DimuonSpectrum_DdorDs.png)
Created on 27 April 2024.