Search for $CP$ violation in $D^{+} \to \phi \pi^{+}$ and $D_{s}^{+} \to K^{0}_{S} \pi^{+}$ decays
[to restricted-access page]Information
LHCb-PAPER-2012-052
CERN-PH-EP-2013-021
arXiv:1303.4906 [PDF]
(Submitted on 20 Mar 2013)
JHEP 06 (2013) 112
Inspire 1224542
Tools
Abstract
A search for CP violation in D+ -> phi pi+ decays is performed using data collected in 2011 by the LHCb experiment corresponding to an integrated luminosity of 1.0 fb^{-1} at a centre of mass energy of 7 TeV. The CP-violating asymmetry is measured to be (-0.04+/-0.14+/-0.14) for candidates with K-K+ mass within 20 MeV/c^{2} of the phi meson mass. A search for a CP-violating asymmetry that varies across the phi mass region of the D+ -> K-K+pi+ Dalitz plot is also performed, and no evidence for CP violation is found. In addition, the CP asymmetry in the Ds+ -> Ks pi+ decay is measured to be (0.61+/-0.83+/-0.14).
Figures and captions
|
Variation of the overall phase of the $ D ^+$ decay amplitude in the $\phi$ mass region of the Dalitz plot, from a simulation study based on the CLEO-c amplitude model in which the phase is defined relative to that of the $ K ^* (892)^{0}$ resonance [14]. To calculate $A_{CP}|_{S}$, the region is divided into rectangular zones as shown, corresponding to $1.00 < m( K ^- K ^+ )< 1.02$ $ {\mathrm{ Ge V /}c^2}$ and $1.02 < m( K ^- K ^+ )< 1.04$ $ {\mathrm{ Ge V /}c^2}$ along the $y$-axis, and to $m^{2}( K ^- \pi ^+ ) < 1.48$ $ {\mathrm{ Ge V^2 /}c^4}$ and $m^{2}( K ^- \pi ^+ ) > 1.48$ $ {\mathrm{ Ge V^2 /}c^4}$ along the $x$-axis. |
Figure1.pdf [148 KiB] HiDef png [1 MiB] Thumbnail [541 KiB] *.C file |

|
|
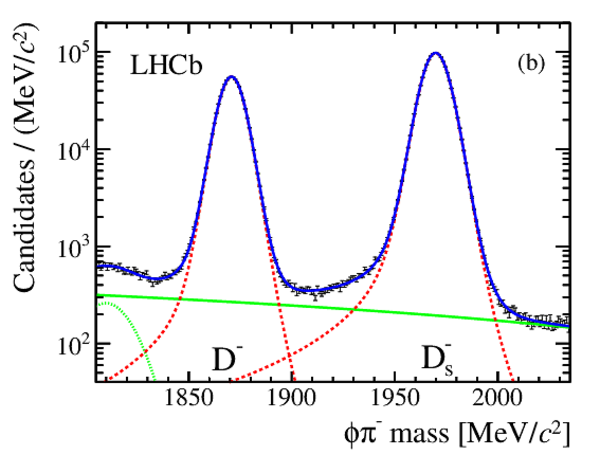
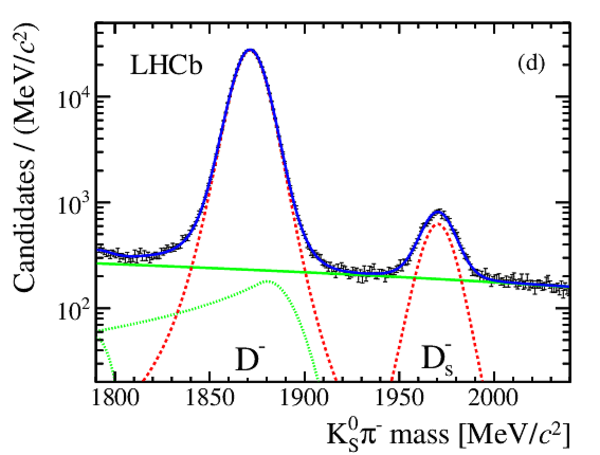
Invariant mass distribution of selected (a) $ D ^+ \rightarrow \phi\pi ^+ $, (b) $ D ^- \rightarrow \phi\pi ^- $, (c) $ D ^+ \rightarrow K ^0_{\rm\scriptscriptstyle S} \pi ^+ $ and (d) $ D ^- \rightarrow K ^0_{\rm\scriptscriptstyle S} \pi ^- $ candidates. The data are represented by symbols with error bars. The red dashed curves indicate the signal lineshapes, the green solid lines represent the combinatorial background shape, and the green dotted lines represent background from mis-reconstructed $ D ^+_ s \rightarrow \phi\pi ^+ \pi ^0 $ decays in (a) and (b), and $ D ^+_ s \rightarrow K ^0_{\rm\scriptscriptstyle S} \pi ^+ \pi ^0 $ or $ D ^+_ s \rightarrow K ^0_{\rm\scriptscriptstyle S} K ^+ $ decays in (c) and (d). The blue solid lines show the sum of all fit components. |
Figure2a.pdf [36 KiB] HiDef png [256 KiB] Thumbnail [195 KiB] *.C file |

|
|
Figure2b.pdf [36 KiB] HiDef png [256 KiB] Thumbnail [194 KiB] *.C file |
|
|
|
Figure2c.pdf [37 KiB] HiDef png [257 KiB] Thumbnail [199 KiB] *.C file |

|
|
|
Figure2d.pdf [37 KiB] HiDef png [256 KiB] Thumbnail [197 KiB] *.C file |
|
|
|
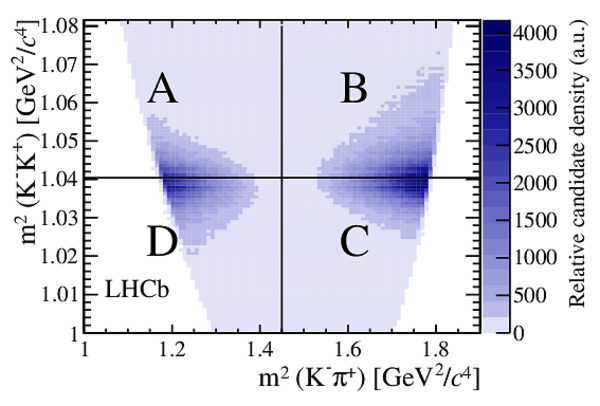
Observed density of decays in the $ D ^+ \rightarrow K ^- K ^+ \pi ^+ $ Dalitz plot, with the regions A-D labelled as described in the text. |
Figure3.pdf [38 KiB] HiDef png [574 KiB] Thumbnail [425 KiB] *.C file |
|
|
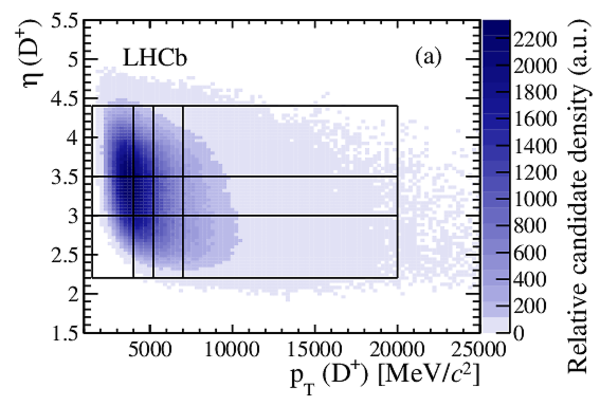
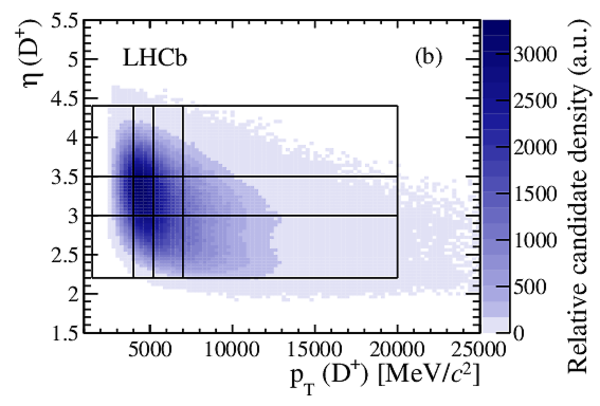
Distributions of transverse momentum $p_{\rm T}$ and pseudorapidity $\eta$ for (a) $ D ^+ \rightarrow K ^0_{\rm\scriptscriptstyle S} \pi ^+ $ and (b) $ D ^+ \rightarrow \phi\pi ^+ $ candidates with invariant masses $m$ in the range $1845 < m < 1895$ $ {\mathrm{ Me V /}c^2}$ . Candidates that do not fall into the 12 rectangular bins are not used in the analysis. |
Figure4a.pdf [32 KiB] HiDef png [571 KiB] Thumbnail [416 KiB] *.C file |
|
|
Figure4b.pdf [31 KiB] HiDef png [519 KiB] Thumbnail [371 KiB] *.C file |
|
|
|
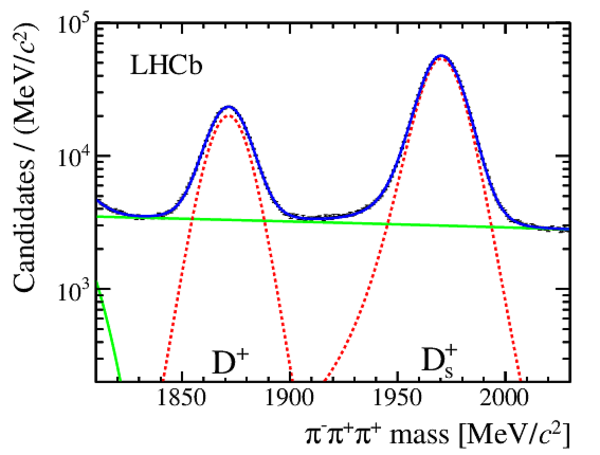
Invariant mass distribution of selected $ D ^{\pm}_{( s )} \rightarrow \pi ^\mp \pi ^\pm \pi ^\pm $ decays. The data are represented by symbols with error bars. The red dashed peaks indicate the signal decays, the green solid lines represent the combinatorial background shape, and the green dotted lines represent backgrounds from mis-reconstructed $ D ^+_ s \rightarrow \pi ^- \pi ^+ \pi ^+ \pi ^0 $ decays. The blue solid line shows the sum of all fit components. |
Figure5.pdf [35 KiB] HiDef png [230 KiB] Thumbnail [177 KiB] *.C file |
|
|
Animated gif made out of all figures. |
PAPER-2012-052.gif Thumbnail |

|
![HiDef png [1 MiB]](Directory_LHCb-PAPER-2012-052/hidef_Figure1.png)
![HiDef png [256 KiB]](Directory_LHCb-PAPER-2012-052/hidef_Figure2a.png)
![HiDef png [256 KiB]](Directory_LHCb-PAPER-2012-052/hidef_Figure2b.png)
![HiDef png [257 KiB]](Directory_LHCb-PAPER-2012-052/hidef_Figure2c.png)
![HiDef png [256 KiB]](Directory_LHCb-PAPER-2012-052/hidef_Figure2d.png)
![HiDef png [574 KiB]](Directory_LHCb-PAPER-2012-052/hidef_Figure3.png)
![HiDef png [571 KiB]](Directory_LHCb-PAPER-2012-052/hidef_Figure4a.png)
![HiDef png [519 KiB]](Directory_LHCb-PAPER-2012-052/hidef_Figure4b.png)
![HiDef png [230 KiB]](Directory_LHCb-PAPER-2012-052/hidef_Figure5.png)
Tables and captions
|
Expected mean values of $A_{CP}$ and $A_{CP}|_{S}$ for different types of $ C P$ violation introduced into the simulated Dalitz plots, together with the significance with which a signal could be observed given estimated overall uncertainties in $A_{CP}$ and $A_{CP}|_{S}$ of 0.2%. |
Table_1.pdf [53 KiB] HiDef png [61 KiB] Thumbnail [28 KiB] tex code |

|
|
Numbers of signal candidates in the four decay modes from the mass fits, with statistical uncertainties only. |
Table_2.pdf [51 KiB] HiDef png [78 KiB] Thumbnail [34 KiB] tex code |

|
|
Raw charge asymmetries, in %, in samples of the $ D ^+ \rightarrow K ^- \pi ^+ \pi ^+ $ control decay in which a particle not from the signal decay activated various hardware triggers. |
Table_3.pdf [31 KiB] HiDef png [63 KiB] Thumbnail [28 KiB] tex code |

|
|
Changes to the final result observed with various alternative kinematic binning schemes. The default scheme uses four bins of $ D ^+_{( s )}$ $p_{\rm T}$ and three bins of $ D ^+_{( s )}$ $\eta$. The variable $\phi$ is the azimuthal angle around the proton beams. The statistical uncertainties are determined by subtracting the uncertainties on the alternative result and the default result in quadrature. |
Table_4.pdf [53 KiB] HiDef png [48 KiB] Thumbnail [22 KiB] tex code |

|
|
Systematic uncertainties on the three measurements. The abbreviation n/a is used where the systematic effect does not apply. The row labelled `Backgrounds' represents the uncertainty in modelling the cross-feed in $A_{CP}$ and the uncertainty from ignoring the background in $A_{CP}|_{S}$. |
Table_5.pdf [48 KiB] HiDef png [88 KiB] Thumbnail [39 KiB] tex code |

|
![HiDef png [61 KiB]](Directory_LHCb-PAPER-2012-052/hidef_Table_1.png)
![HiDef png [78 KiB]](Directory_LHCb-PAPER-2012-052/hidef_Table_2.png)
![HiDef png [63 KiB]](Directory_LHCb-PAPER-2012-052/hidef_Table_3.png)
![HiDef png [48 KiB]](Directory_LHCb-PAPER-2012-052/hidef_Table_4.png)
![HiDef png [88 KiB]](Directory_LHCb-PAPER-2012-052/hidef_Table_5.png)
Created on 27 April 2024.