Measurements of the $\Lambda_b^0 \to J/\psi \Lambda$ decay amplitudes and the $\Lambda_b^0$ polarisation in $pp$ collisions at $\sqrt{s} = 7$ TeV
[to restricted-access page]Information
LHCb-PAPER-2012-057
CERN-PH-EP-2013-020
arXiv:1302.5578 [PDF]
(Submitted on 22 Feb 2013)
Phys. Lett. B724 (2013) 27
Inspire 1220792
Tools
Abstract
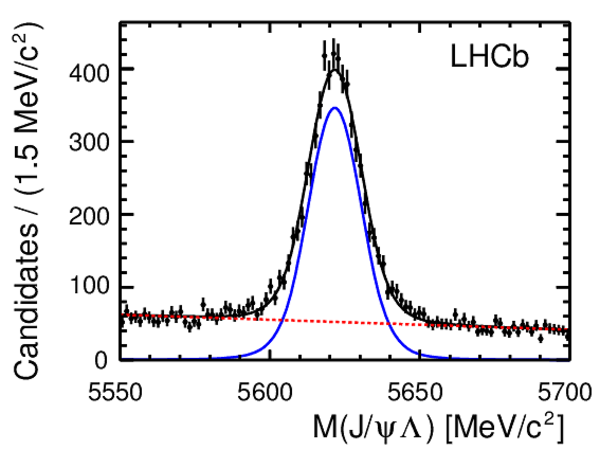
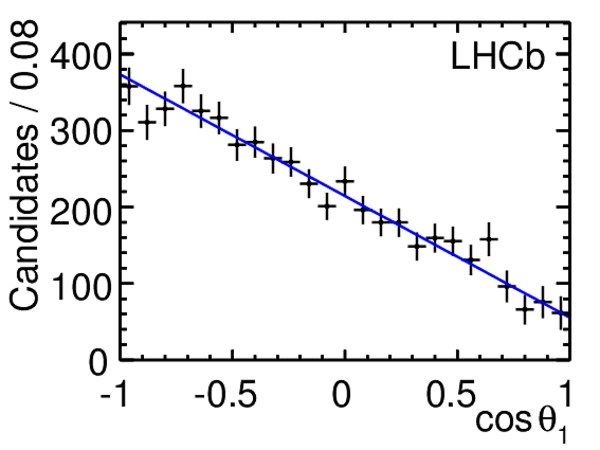
An angular analysis of Lambda_b0 -> J/psi Lambda decays is performed using a data sample corresponding to 1.0 fb^{-1} collected in pp collisions at sqrt(s) = 7 TeV with the LHCb detector at the LHC. A parity violating asymmetry parameter characterising the Lambda_b0 -> J/psi Lambda decay of 0.05 +/- 0.17 +/- 0.07 and a Lambda_b0 transverse production polarisation of 0.06 +/- 0.07 +/- 0.02 are measured, where the first uncertainty is statistical and the second systematic.
Figures and captions


![HiDef png [210 KiB]](Directory_LHCb-PAPER-2012-057/hidef_Fig1.png)
![HiDef png [211 KiB]](Directory_LHCb-PAPER-2012-057/hidef_Fig2a.png)
![HiDef png [200 KiB]](Directory_LHCb-PAPER-2012-057/hidef_Fig2b.png)
![HiDef png [141 KiB]](Directory_LHCb-PAPER-2012-057/hidef_Fig3a.png)
![HiDef png [145 KiB]](Directory_LHCb-PAPER-2012-057/hidef_Fig3b.png)
![HiDef png [130 KiB]](Directory_LHCb-PAPER-2012-057/hidef_Fig3c.png)
![HiDef png [141 KiB]](Directory_LHCb-PAPER-2012-057/hidef_Fig3d.png)
![HiDef png [134 KiB]](Directory_LHCb-PAPER-2012-057/hidef_Fig3e.png)
![HiDef png [121 KiB]](Directory_LHCb-PAPER-2012-057/hidef_Fig3f.png)
![HiDef png [117 KiB]](Directory_LHCb-PAPER-2012-057/hidef_Fig4a.png)
![HiDef png [143 KiB]](Directory_LHCb-PAPER-2012-057/hidef_Fig4b.png)
![HiDef png [137 KiB]](Directory_LHCb-PAPER-2012-057/hidef_Fig4c.png)
![HiDef png [110 KiB]](Directory_LHCb-PAPER-2012-057/hidef_Fig4d.png)
![HiDef png [133 KiB]](Directory_LHCb-PAPER-2012-057/hidef_Fig4e.png)
![HiDef png [131 KiB]](Directory_LHCb-PAPER-2012-057/hidef_Fig4f.png)
Tables and captions
|
Theoretical predictions for the $\Lambda ^0_ b \to { J \mskip -3mu/\mskip -2mu\psi \mskip 2mu} \Lambda $ decay asymmetry parameter $\alpha_b$ . |
Table_1.pdf [32 KiB] HiDef png [57 KiB] Thumbnail [27 KiB] tex code |

|
|
Functions used to describe the angular distributions in three dimensions. |
Table_2.pdf [43 KiB] HiDef png [76 KiB] Thumbnail [36 KiB] tex code |

|
|
Absolute systematic uncertainties on the measured parameters. |
Table_3.pdf [39 KiB] HiDef png [76 KiB] Thumbnail [36 KiB] tex code |

|
![HiDef png [57 KiB]](Directory_LHCb-PAPER-2012-057/hidef_Table_1.png)
![HiDef png [76 KiB]](Directory_LHCb-PAPER-2012-057/hidef_Table_2.png)
![HiDef png [76 KiB]](Directory_LHCb-PAPER-2012-057/hidef_Table_3.png)
Created on 26 April 2024.