Search for direct $CP$ violation in $D^0 \rightarrow h^- h^+$ modes using semileptonic $B$ decays
[to restricted-access page]Information
LHCb-PAPER-2013-003
CERN-PH-EP-2013-039
arXiv:1303.2614 [PDF]
(Submitted on 11 Mar 2013)
Phys. Lett. B723 (2013) 33
Inspire 1223327
Tools
Abstract
A search for direct CP violation in D0 -> h- h+ (where h=K or pi) is presented using data corresponding to an integrated luminosity of 1.0 fb^-1 collected in 2011 by LHCb in pp collisions at a centre-of-mass energy of 7 TeV. The analysis uses D0 mesons produced in inclusive semileptonic b-hadron decays to the D0 mu X final state, where the charge of the accompanying muon is used to tag the flavour of the D0 meson. The difference in the CP-violating asymmetries between the two decay channels is measured to be Delta A_CP = A_CP(K-K+) - A_CP(pi-pi+) = (0.49 +- 0.30 (stat) +- 0.14 (syst)) . This result does not confirm the evidence for direct CP violation in the charm sector reported in other analyses.
Figures and captions
|
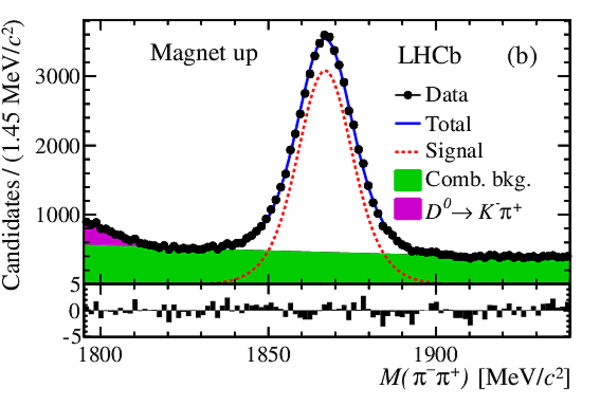
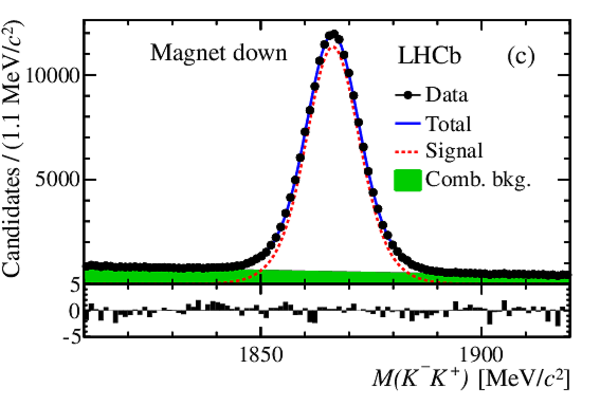
Invariant mass distributions for (a, c) $ D ^0 \rightarrow K ^- K ^+ $ and (b, d) $ D ^0 \rightarrow \pi ^- \pi ^+ $ muon-tagged candidates for the two magnet polarities. The result of the fit is overlaid, showing the contribution from signal, combinatorial background and $ D ^0 \rightarrow K ^- \pi ^+ $ reflection. Underneath each plot the pull in each mass bin is shown. |
plot_a[..].pdf [36 KiB] HiDef png [207 KiB] Thumbnail [183 KiB] *.C file |

|
|
plot_a[..].pdf [36 KiB] HiDef png [224 KiB] Thumbnail [202 KiB] *.C file |
|
|
|
plot_a[..].pdf [35 KiB] HiDef png [200 KiB] Thumbnail [174 KiB] *.C file |
|
|
|
plot_a[..].pdf [36 KiB] HiDef png [221 KiB] Thumbnail [196 KiB] *.C file |

|
|
|
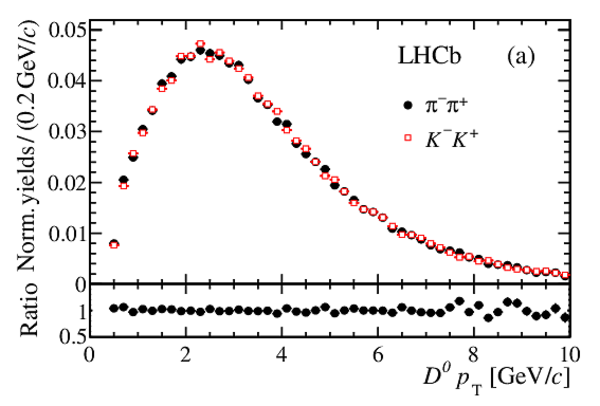
Kinematic distributions of the (a, c) $ D ^0$ meson and (b, d) muon for $ D ^0 \rightarrow \pi ^- \pi ^+ $ (black circles) and $ D ^0 \rightarrow K ^- K ^+ $ (red squares) candidates normalised to unit area. The histograms show the distributions of signal candidates, after background subtraction. Underneath each plot the ratio of the two distributions is shown. |
plot_u[..].pdf [22 KiB] HiDef png [186 KiB] Thumbnail [178 KiB] *.C file |

|
|
plot_u[..].pdf [21 KiB] HiDef png [194 KiB] Thumbnail [184 KiB] *.C file |

|
|
|
plot_u[..].pdf [20 KiB] HiDef png [168 KiB] Thumbnail [162 KiB] *.C file |

|
|
|
plot_u[..].pdf [21 KiB] HiDef png [166 KiB] Thumbnail [161 KiB] *.C file |

|
|
|
Kinematic distributions of the (a, c) $ D ^0$ meson and (b, d) muon for $ D ^0 \rightarrow \pi ^- \pi ^+ $ (black circles) and $ D ^0 \rightarrow K ^- K ^+ $ (red squares) candidates normalised to unit area after the weighting procedure. The histograms show the distributions of signal candidates, after background subtraction. Underneath each plot the ratio of the two distributions is shown. |
plot_u[..].pdf [22 KiB] HiDef png [184 KiB] Thumbnail [170 KiB] *.C file |
|
|
plot_u[..].pdf [21 KiB] HiDef png [194 KiB] Thumbnail [183 KiB] *.C file |

|
|
|
plot_u[..].pdf [21 KiB] HiDef png [172 KiB] Thumbnail [161 KiB] *.C file |

|
|
|
plot_u[..].pdf [21 KiB] HiDef png [164 KiB] Thumbnail [154 KiB] *.C file |

|
|
|
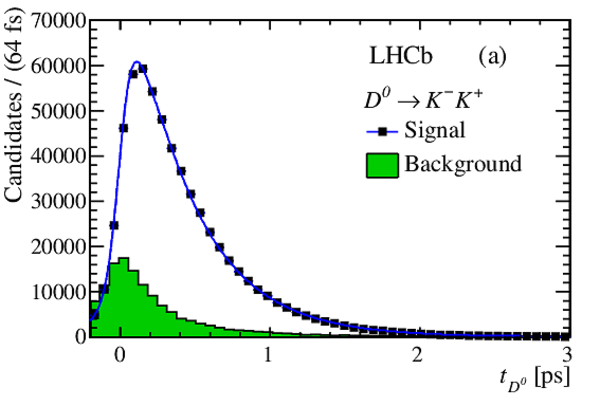
Decay time distribution for signal candidates (solid points) with the result from the fit overlaid for (a) $ D ^0 \rightarrow K ^- K ^+ $ and (b) $ D ^0 \rightarrow \pi ^- \pi ^+ $ decays. The distribution for background candidates scaled to a $\pm34 {\mathrm{ Me V /}c^2} $ window around the nominal $ D ^0$ mass is shown in the shaded (green) region. The distributions for signal and background candidates are obtained using the sPlot method. |
lifeti[..].pdf [10 KiB] HiDef png [176 KiB] Thumbnail [159 KiB] *.C file |
|
|
lifeti[..].pdf [10 KiB] HiDef png [172 KiB] Thumbnail [153 KiB] *.C file |

|
|
|
Raw asymmetries and $\Delta A_{ C P }$ as a function of (a) $p_{\rm T}$ and (b) $\eta$ of the $ D ^0$ meson. No weighting is applied. |
plot_c[..].pdf [15 KiB] HiDef png [123 KiB] Thumbnail [118 KiB] *.C file |

|
|
plot_c[..].pdf [14 KiB] HiDef png [102 KiB] Thumbnail [102 KiB] *.C file |

|
|
|
Animated gif made out of all figures. |
PAPER-2013-003.gif Thumbnail |

|
![HiDef png [207 KiB]](Directory_LHCb-PAPER-2013-003/hidef_plot_asym_KK_up.png)
![HiDef png [224 KiB]](Directory_LHCb-PAPER-2013-003/hidef_plot_asym_pipi_up.png)
![HiDef png [200 KiB]](Directory_LHCb-PAPER-2013-003/hidef_plot_asym_KK_down.png)
![HiDef png [221 KiB]](Directory_LHCb-PAPER-2013-003/hidef_plot_asym_pipi_down.png)
![HiDef png [186 KiB]](Directory_LHCb-PAPER-2013-003/hidef_plot_up_unweighted_d0Pt.png)
![HiDef png [194 KiB]](Directory_LHCb-PAPER-2013-003/hidef_plot_up_unweighted_muonPt.png)
![HiDef png [168 KiB]](Directory_LHCb-PAPER-2013-003/hidef_plot_up_unweighted_d0Eta.png)
![HiDef png [166 KiB]](Directory_LHCb-PAPER-2013-003/hidef_plot_up_unweighted_muonEta.png)
![HiDef png [184 KiB]](Directory_LHCb-PAPER-2013-003/hidef_plot_up_weighted_d0Pt.png)
![HiDef png [194 KiB]](Directory_LHCb-PAPER-2013-003/hidef_plot_up_weighted_muonPt.png)
![HiDef png [172 KiB]](Directory_LHCb-PAPER-2013-003/hidef_plot_up_weighted_d0Eta.png)
![HiDef png [164 KiB]](Directory_LHCb-PAPER-2013-003/hidef_plot_up_weighted_muonEta.png)
![HiDef png [176 KiB]](Directory_LHCb-PAPER-2013-003/hidef_lifetime_d2kk.png)
![HiDef png [172 KiB]](Directory_LHCb-PAPER-2013-003/hidef_lifetime_d2pipi.png)
![HiDef png [123 KiB]](Directory_LHCb-PAPER-2013-003/hidef_plot_crosscheck_d0Pt.png)
![HiDef png [102 KiB]](Directory_LHCb-PAPER-2013-003/hidef_plot_crosscheck_d0Eta.png)
Tables and captions
|
Unweighted raw asymmetries (in %) for the $ D ^0 \rightarrow \pi ^- \pi ^+ $ , $ D ^0 \rightarrow K ^- K ^+ $ and $ D ^0 \rightarrow K ^- \pi ^+ $ decays for the two magnet polarities. The mean value is the arithmetic average over the two polarities. The uncertainties are statistical only. |
Table_1.pdf [53 KiB] HiDef png [60 KiB] Thumbnail [29 KiB] tex code |

|
|
Weighted raw asymmetries (in %) for the $ D ^0 \rightarrow \pi ^- \pi ^+ $ and $ D ^0 \rightarrow K ^- K ^+ $ decays for the two magnet polarities. The mean value is the arithmetic average over the two polarities. The uncertainties are statistical only. |
Table_2.pdf [52 KiB] HiDef png [46 KiB] Thumbnail [22 KiB] tex code |

|
|
Contributions to the systematic uncertainty of $\Delta A_{ C P }$ . |
Table_3.pdf [81 KiB] HiDef png [135 KiB] Thumbnail [64 KiB] tex code |

|
![HiDef png [60 KiB]](Directory_LHCb-PAPER-2013-003/hidef_Table_1.png)
![HiDef png [46 KiB]](Directory_LHCb-PAPER-2013-003/hidef_Table_2.png)
![HiDef png [135 KiB]](Directory_LHCb-PAPER-2013-003/hidef_Table_3.png)
Created on 27 April 2024.