Precision measurement of the $B^0_s - \bar{B}^0_s$ oscillation frequency with the decay $B^0_s \to D^-_s \pi^+$
[to restricted-access page]Information
LHCb-PAPER-2013-006
CERN-PH-EP-2013-054
arXiv:1304.4741 [PDF]
(Submitted on 17 Apr 2013)
New J. Phys. 15 (2013) 053021
Inspire 1228694
Tools
Abstract
A key ingredient to searches for physics beyond the Standard Model in $B^{0}_{s}$ mixing phenomena is the measurement of the $B^{0}_{s}$-$\bar{B}^{0}_{s}$ oscillation frequency, which is equivalent to the mass difference $\Delta m_{s}$ of the $B^{0}_{s}$ mass eigenstates. Using the world's largest $B^{0}_{s}$ meson sample accumulated in a dataset, corresponding to an integrated luminosity of 1.0 fb$^{-1}$, collected by the LHCb experiment at the CERN LHC in 2011, a measurement of $\Delta m_{s}$ is presented. A total of about 34,000 $B^{0}_{s}\rightarrowD^{-}_{s}\pi^{+}$ signal decays are reconstructed, with an average decay time resolution of 44 fs. The oscillation frequency is measured to be $\Delta m_{s}$ = 17.768 $\pm$ 0.023 (stat) $\pm$ 0.006 (syst) ps$^{-1}$, which is the most precise measurement to date.
Figures and captions
|
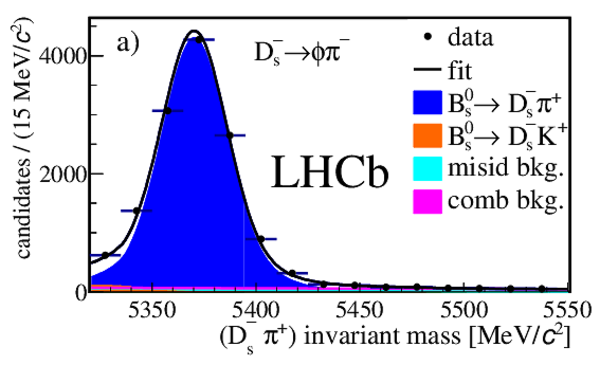
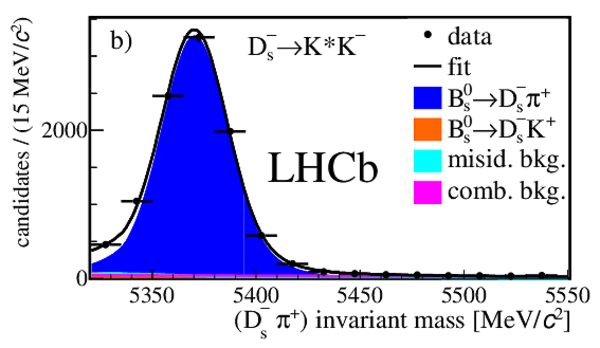
Invariant mass distributions for $ B ^0_ s \rightarrow D ^-_ s \pi ^+ $ candidates with the $ D ^-_ s $ meson decaying as a) $ D ^-_ s \rightarrow \phi( K ^+ K ^- )\pi ^- $ , b) $ D ^-_ s \rightarrow K ^{*0} ( K ^+ \pi ^- ) K ^- $ , c) $ D ^-_ s \rightarrow K ^+ K ^- \pi ^- $ nonresonant, d) $ D ^-_ s \rightarrow K ^- \pi ^+ \pi ^- $ , and e) $ D ^-_ s \rightarrow \pi ^- \pi ^+ \pi ^- $ . The fits and the various background components are described in the text. Misidentified backgrounds refer to background from $ B ^0$ and $\Lambda ^0_ b $ decays with one misidentified daughter particle. |
m_phip[..].pdf [14 KiB] HiDef png [216 KiB] Thumbnail [180 KiB] *.C file |
|
|
m_ksta[..].pdf [14 KiB] HiDef png [187 KiB] Thumbnail [171 KiB] *.C file |
|
|
|
m_nonr[..].pdf [14 KiB] HiDef png [197 KiB] Thumbnail [187 KiB] *.C file |

|
|
|
m_kpip[..].pdf [15 KiB] HiDef png [191 KiB] Thumbnail [182 KiB] *.C file |

|
|
|
m_pipi[..].pdf [14 KiB] HiDef png [181 KiB] Thumbnail [166 KiB] *.C file |

|
|
|
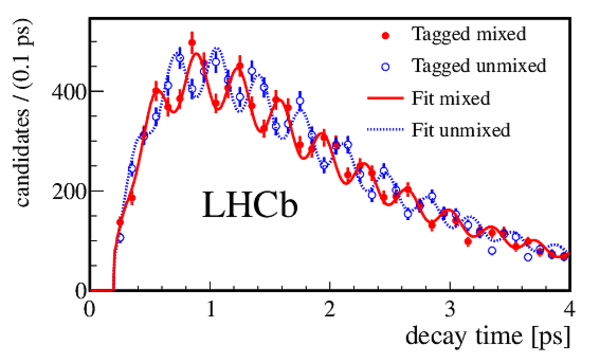
Decay time distribution for the sum of the five decay modes for candidates tagged as mixed (different flavour at decay and production; red, continuous line) or unmixed (same flavour at decay and production; blue, dotted line). The data and the fit projections are plotted in a signal window around the reconstructed $ B ^0_ s $ mass of 5.32 -- 5.55 $ {\mathrm{ Ge V /}c^2}$ . |
mixing[..].pdf [18 KiB] HiDef png [237 KiB] Thumbnail [160 KiB] *.C file |
|
|
Animated gif made out of all figures. |
PAPER-2013-006.gif Thumbnail |

|
![HiDef png [216 KiB]](Directory_LHCb-PAPER-2013-006/hidef_m_phipi_narrow.png)
![HiDef png [187 KiB]](Directory_LHCb-PAPER-2013-006/hidef_m_kstark_narrow.png)
![HiDef png [197 KiB]](Directory_LHCb-PAPER-2013-006/hidef_m_nonres_narrow.png)
![HiDef png [191 KiB]](Directory_LHCb-PAPER-2013-006/hidef_m_kpipi_narrow.png)
![HiDef png [181 KiB]](Directory_LHCb-PAPER-2013-006/hidef_m_pipipi_narrow.png)
![HiDef png [237 KiB]](Directory_LHCb-PAPER-2013-006/hidef_mixing_plot.png)
Tables and captions
|
Number of candidates and $ B ^0_ s $ signal fractions in the mass range 5.32 -- 5.98 $ {\mathrm{ Ge V /}c^2}$ . |
Table_1.pdf [52 KiB] HiDef png [47 KiB] Thumbnail [20 KiB] tex code |

|
|
Systematic uncertainties on the $\Delta m_{ s }$ measurement. The total systematic uncertainty is calculated as the quadratic sum of the individual contributions. |
Table_2.pdf [36 KiB] HiDef png [47 KiB] Thumbnail [21 KiB] tex code |

|
![HiDef png [47 KiB]](Directory_LHCb-PAPER-2013-006/hidef_Table_1.png)
![HiDef png [47 KiB]](Directory_LHCb-PAPER-2013-006/hidef_Table_2.png)
Created on 02 May 2024.