Observation of $B^+_c \rightarrow J/\psi D_s^+$ and $B^+_c \rightarrow J/\psi D_s^{*+}$ decays
[to restricted-access page]Information
LHCb-PAPER-2013-010
CERN-PH-EP-2013-051
arXiv:1304.4530 [PDF]
(Submitted on 16 Apr 2013)
Phys. Rev. D87 (2013) 112012
Inspire 1228506
Tools
Abstract
The decays $B^+_c \rightarrow J/\psi D_s^+$ and $B^+_c \rightarrow J/\psi D_s^{*+}$ are observed for the first time using a dataset, corresponding to an integrated luminosity of 3$fb^{-1}$, collected by the LHCb experiment in proton-proton collisions at centre-of-mass energies of $\sqrt{s}$=7 and 8 TeV. The statistical significance for both signals is in excess of 9 standard deviations. The following ratios of branching fractions are measured to be $BR(B^+_c \rightarrow J/\psi D_s^+)/BR(B^+_c \rightarrow J/\psi \pi+) = 2.90 \pm 0.57 \pm 0.24$, $BR(B^+_c \rightarrow J/\psi D_s^{*+}) / BR (B^+_c \rightarrow J/\psi D_s^+) = 2.37 \pm 0.56 \pm 0.10$, where the first uncertainties are statistical and the second systematic. The mass of the \Bc meson is measured to be $m_{B^+_c} = 6276.28 \pm 1.44 (stat) \pm 0.36(syst) MeV/c^2$, using the $B^+_c \rightarrow J/\psi D_s^+$ decay mode.
Figures and captions
|
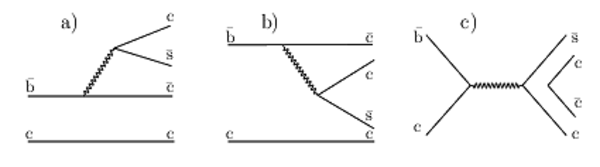
Feynman diagrams for $ B _ c ^+ {}\rightarrow {} { J \mskip -3mu/\mskip -2mu\psi \mskip 2mu} {} D ^+_ s $ decays: (a) spectator, (b) colour-suppressed spectator and (c) annihilation topology. |
Figure1.pdf [106 KiB] HiDef png [43 KiB] Thumbnail [22 KiB] *.C file |
|
|
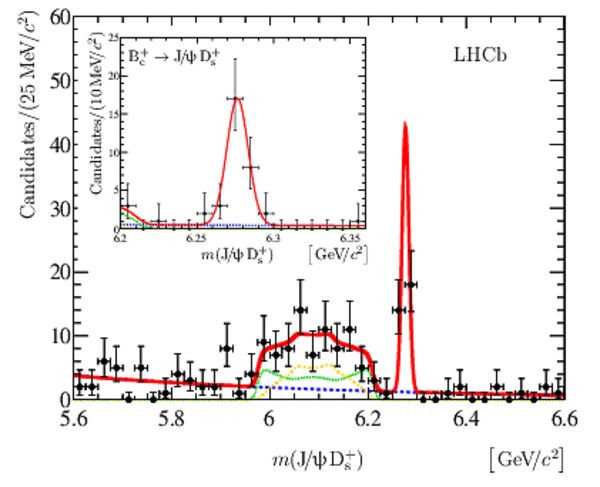
Mass distributions for selected $ { J \mskip -3mu/\mskip -2mu\psi \mskip 2mu}$ {} $ D ^+_ s $ pairs. The solid curve represents the result of a fit to the model described in the text. The contribution from the $ B _ c ^+ \rightarrow { J \mskip -3mu/\mskip -2mu\psi \mskip 2mu} D ^{\ast+}_{\mathrm{s}}$ decay is shown with thin green dotted and thin yellow dash-dotted lines for the $\mathcal{A}_{\pm\pm}$ and $\mathcal{A}_{00}$ amplitudes, respectively. The insert shows a zoom of the $ B _ c ^+$ mass region. |
Figure2.pdf [159 KiB] HiDef png [319 KiB] Thumbnail [279 KiB] *.C file |
|
|
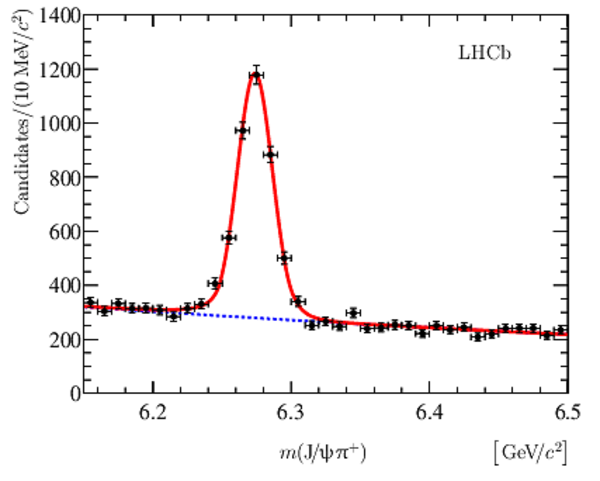
Mass distribution for selected $ B _ c ^+ {}\rightarrow {} { J \mskip -3mu/\mskip -2mu\psi \mskip 2mu} {}\pi ^+ $ candidates. The results of a fit to the model described in the text are superimposed (solid line) together with the background component (dotted line). |
Figure3.pdf [98 KiB] HiDef png [180 KiB] Thumbnail [168 KiB] *.C file |
|
|
Distributions of (a) $\chi^2_{\mathrm{fit}}( B _ c ^+ )$ and (b) $\chi^2_{\mathrm{IP}}( B _ c ^+ )$ for $ B _ c ^+ {}\rightarrow {} { J \mskip -3mu/\mskip -2mu\psi \mskip 2mu} {}\pi ^+ $ events: background subtracted data (red points with error bars), and simulation (blue histogram). |
Figure4.pdf [112 KiB] HiDef png [197 KiB] Thumbnail [168 KiB] *.C file |

|
|
Animated gif made out of all figures. |
PAPER-2013-010.gif Thumbnail |

|
![HiDef png [43 KiB]](Directory_LHCb-PAPER-2013-010/hidef_Figure1.png)
![HiDef png [319 KiB]](Directory_LHCb-PAPER-2013-010/hidef_Figure2.png)
![HiDef png [180 KiB]](Directory_LHCb-PAPER-2013-010/hidef_Figure3.png)
![HiDef png [197 KiB]](Directory_LHCb-PAPER-2013-010/hidef_Figure4.png)
Tables and captions
|
Predictions for the ratios of $ B _ c ^+$ meson branching fractions. In the case of $\mathcal{R}_{ D {}^{\ast+}_{\mathrm{s}} \mskip -6mu/ D ^+_ s }$ the second uncertainty is related to the unknown relative orbital momentum. |
Table_1.pdf [64 KiB] HiDef png [41 KiB] Thumbnail [20 KiB] tex code |

|
|
Signal parameters of the unbinned extended maximum likelihood fit to the $ { J \mskip -3mu/\mskip -2mu\psi \mskip 2mu}$ {} $ D ^+_ s $ mass distribution. |
Table_2.pdf [80 KiB] HiDef png [35 KiB] Thumbnail [17 KiB] tex code |

|
|
Relative systematic uncertainties for the ratio of branching fractions of $ B _ c ^+ {}\rightarrow {} { J \mskip -3mu/\mskip -2mu\psi \mskip 2mu} {} D ^+_ s $ and $ B _ c ^+ {}\rightarrow {} { J \mskip -3mu/\mskip -2mu\psi \mskip 2mu} {}\pi ^+ $ . |
Table_3.pdf [63 KiB] HiDef png [80 KiB] Thumbnail [37 KiB] tex code |

|
![HiDef png [41 KiB]](Directory_LHCb-PAPER-2013-010/hidef_Table_1.png)
![HiDef png [35 KiB]](Directory_LHCb-PAPER-2013-010/hidef_Table_2.png)
![HiDef png [80 KiB]](Directory_LHCb-PAPER-2013-010/hidef_Table_3.png)
Created on 26 April 2024.