Information
LHCb-PAPER-2013-011
CERN-PH-EP-2013-053
arXiv:1304.6865 [PDF]
(Submitted on 25 Apr 2013)
JHEP 06 (2013) 65
Inspire 1230340
Tools
Abstract
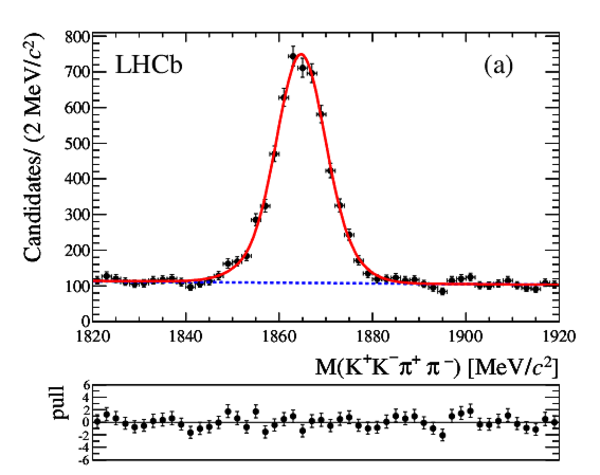
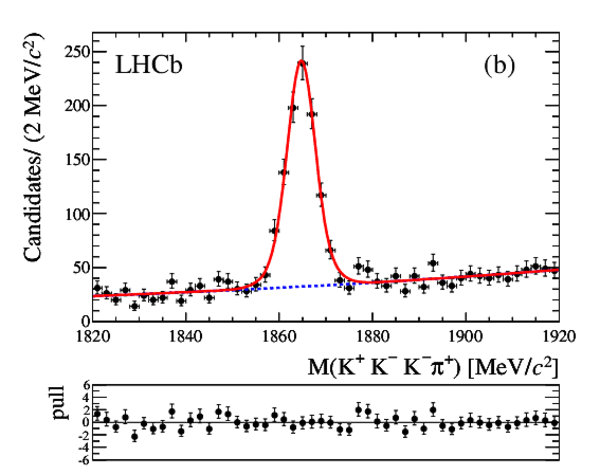
Using three- and four-body decays of $D$ mesons produced in semileptonic $b$-hadron decays, precision measurements of $D$ meson mass differences are made together with a measurement of the $D^{0}$ mass. The measurements are based on a dataset corresponding to an integrated luminosity of $1.0 fb^{-1}$ collected in $pp$ collisions at 7 TeV. Using the decay $D^0 \rightarrow K^{+} K^{-} K^{-} \pi^{+}$, the $D^0$ mass is measured to be $M(D^0) &=& 1864.75 \pm 0.15 ({\rm stat}) \pm 0.11 ({\rm syst}) \textrm{MeV/c^2}$. The mass differences $M(D^{+}) - M(D^{0}) = 4.76 \pm 0.12 ({\rm stat}) \pm 0.07 ({\rm syst}) \textrm{MeV/c^2}$ and $M(D^{+}_s) - M(D^{+}) = 98.68 \pm 0.03 ({\rm stat}) \pm 0.04 ({\rm syst}) \textrm{MeV/c^2}$ are measured using the $D^0 \rightarrow K^{+} K^{-} \pi^{+} \pi^{-}$ and $D^{+}_{(s)} \rightarrow K^{+}K^{-} \pi^{+}$ modes.
Figures and captions
|
Invariant mass distributions for the (a) $K^{+} K^{-} \pi^{+} \pi^{-} $ and (b) $K^{+} K^{-} K^{-} \pi^{+}$ final states. In each case the result of the fit described in the text is superimposed (solid line) together with the background component (dotted line). The pull, i.e. the difference between the fitted and measured value divided by the uncertainty on the measured value, is shown below each plot. |
pretty[..].pdf [13 KiB] HiDef png [230 KiB] Thumbnail [198 KiB] *.C file |
|
|
pretty[..].pdf [13 KiB] HiDef png [231 KiB] Thumbnail [199 KiB] *.C file |
|
|
|
Invariant mass distribution for the $K^{+} K^{-} \pi^{+}$ final state. The result of the fit described in the text is superimposed (solid line) together with the background component (dotted line). The pull, i.e. the difference between the fitted value and the measured value divided by the uncertainty, is shown below the plot. |
pretty[..].pdf [22 KiB] HiDef png [238 KiB] Thumbnail [204 KiB] *.C file |

|
|
Measured $D^0$ mass versus $f$ as defined in Eq. 2. The (yellow) shaded area corresponds to a systematic uncertainty on the momentum scale of $0.03 \%$ centred on the result for the $D^0 \rightarrow K^{+} K^{-} K^{-} \pi^{+}$ mode (horizontal dashed line). Only the $D^0 \rightarrow K^{+} K^{-} K^{-} \pi^{+}$ mode, where the systematic uncertainty is lowest, is used to determine the $D^0$ mass. |
dmasssyst.pdf [4 KiB] HiDef png [125 KiB] Thumbnail [101 KiB] *.C file |

|
|
Animated gif made out of all figures. |
PAPER-2013-011.gif Thumbnail |

|
![HiDef png [230 KiB]](Directory_LHCb-PAPER-2013-011/hidef_pretty_kkpp.png)
![HiDef png [231 KiB]](Directory_LHCb-PAPER-2013-011/hidef_pretty_kkkp.png)
![HiDef png [238 KiB]](Directory_LHCb-PAPER-2013-011/hidef_pretty_defaultDPlus.png)
![HiDef png [125 KiB]](Directory_LHCb-PAPER-2013-011/hidef_dmasssyst.png)
Tables and captions
|
Signal yields, mass values, resolution scale factors and binned $\chi^2$/ndf (using 100 bins) obtained from the fits shown in Fig. 1 and Fig. 2 together with the values corrected for the effect of QED radiative corrections as described in the text. |
Table_1.pdf [54 KiB] HiDef png [58 KiB] Thumbnail [25 KiB] tex code |

|
|
Systematic uncertainties (in $ {\mathrm{ Me V /}c^2}$ ) on the mass measurements and on their differences. |
Table_2.pdf [51 KiB] HiDef png [57 KiB] Thumbnail [26 KiB] tex code |

|
|
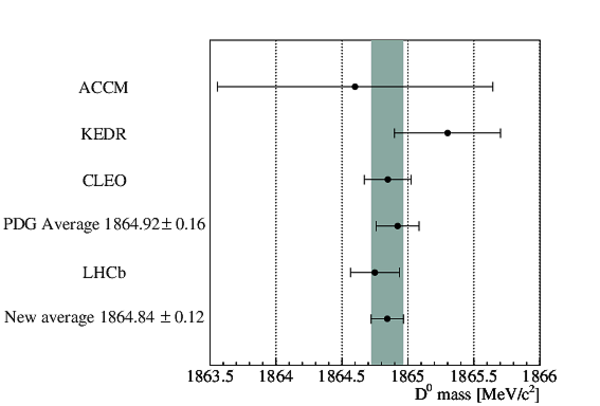
LHCb measurements, compared to the best previous measurements and to the results of a global fit to available open charm mass data. The quoted uncertainties are the quadratic sums of the statistical and systematic contributions. All values are in $ {\mathrm{ Me V /}c^2}$ . |
Table_3.pdf [46 KiB] HiDef png [47 KiB] Thumbnail [23 KiB] tex code |

|
![HiDef png [58 KiB]](Directory_LHCb-PAPER-2013-011/hidef_Table_1.png)
![HiDef png [57 KiB]](Directory_LHCb-PAPER-2013-011/hidef_Table_2.png)
![HiDef png [47 KiB]](Directory_LHCb-PAPER-2013-011/hidef_Table_3.png)
Supplementary Material [file]
|
This ZIP file contains supplemetary material for the publication LHCb-PAPER-2013-013. The files are: Fig1.* D0 mass comparision Fig2.* D+ - D0 mass difference comparision Fig3.* Ds+ - D+ mass difference comparision Supplementary.pdf : An overview of the extra figures *.pdf, *.png, *.eps : The figures in variuous formats |
Fig1.pdf [3 KiB] HiDef png [143 KiB] Thumbnail [125 KiB] *C file |
|
|
Fig3.pdf [4 KiB] HiDef png [145 KiB] Thumbnail [138 KiB] *C file |

|
|
|
supple[..].pdf [81 KiB] HiDef png [247 KiB] Thumbnail [144 KiB] *C file |

|
![HiDef png [143 KiB]](Directory_LHCb-PAPER-2013-011/supplementary/hidef_Fig1.png)
![HiDef png [145 KiB]](Directory_LHCb-PAPER-2013-011/supplementary/hidef_Fig3.png)
![HiDef png [247 KiB]](Directory_LHCb-PAPER-2013-011/supplementary/hidef_supplementarystuff.png)
Created on 27 April 2024.