Information
LHCb-PAPER-2013-012
CERN-PH-EP-2013-087
arXiv:1306.2239 [PDF]
(Submitted on 10 Jun 2013)
JHEP 11 (2013) 92
Inspire 1237918
Tools
Abstract
The first observation of the decay $B_s^0 \rightarrow \phi \bar{K}^{*0}$ is reported. The analysis is based on a data sample corresponding to an integrated luminosity of 1.0 fb$^{-1}$ of $pp$ collisions at $\sqrt{s} = 7 TeV$, collected with the LHCb detector. A yield of $30 \pm 6$ $B_s^0 \rightarrow (K^+K^-)(K^-\pi^+)$ decays is found in the mass windows $1012.5 < M(K^+K^-) < 1026.5 MeV/c^2$ and $746 < M(K^-\pi^+)< 1046 MeV/c^2$. The signal yield is found to be dominated by $B_s^0 \rightarrow \phi \bar{K}^{*0}$ decays, and the corresponding branching fraction is measured to be ${\cal B}(B_s^0 \rightarrow \phi \bar{K}^{*0}) = (1.10 \pm 0.24 (stat) \pm 0.14 (syst) \pm 0.08 (f_d/f_s)) \times 10^{-6}$, where the uncertainties are statistical, systematic and from the ratio of fragmentation fractions $f_d/f_s$ which accounts for the different production rate of $B^0$ and $B_s^0$ mesons. The significance of $B_s^0 \rightarrow \phi \bar{K}^{*0}$ signal is 6.1 standard deviations. The fraction of longitudinal polarization in $B_s^0 \rightarrow \phi \bar{K}^{*0}$ decays is found to be $f_0 = 0.51 \pm 0.15 (stat) \pm 0.07 (syst)$.
Figures and captions
|
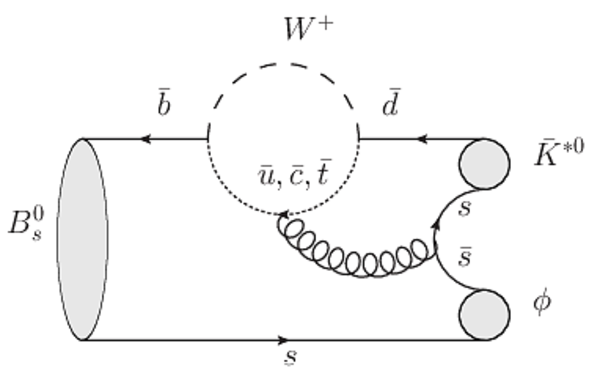
Feynman diagrams for the $ B ^0_ s \rightarrow \phi \overline{ K }{} ^{*0} $ and the $ B ^0 \rightarrow \phi K ^{*0} $ decays. |
pengui[..].pdf [9 KiB] HiDef png [198 KiB] Thumbnail [121 KiB] *.C file |
|
|
pengui[..].pdf [9 KiB] HiDef png [196 KiB] Thumbnail [119 KiB] *.C file |

|
|
|
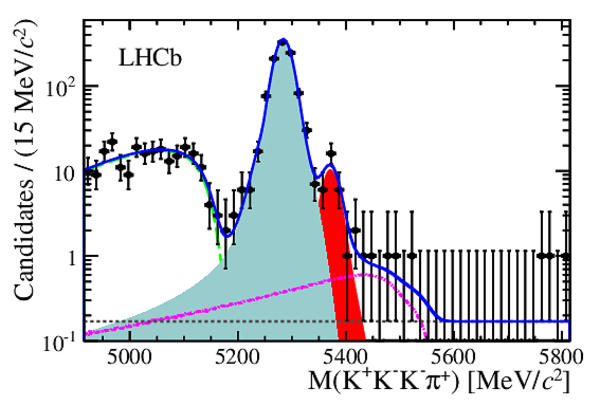
Four-body $ K^+K^- K^-\pi^+ $ invariant mass distribution. The points show the data, the blue solid line shows the overall fit, the solid dark red shaded region is the $ B ^0_ s \rightarrow \phi \overline{ K }{} ^{*0} $ signal, the light blue shaded region corresponds to the $ B ^0 \rightarrow \phi K ^{*0} $ signal, the grey dotted line is the combinatorial background and the green dashed line and magenta dashed-dotted lines are the partially reconstructed and misidentified $\Lambda ^0_ b $ backgrounds. |
four-b[..].pdf [49 KiB] HiDef png [856 KiB] Thumbnail [215 KiB] *.C file |
|
|
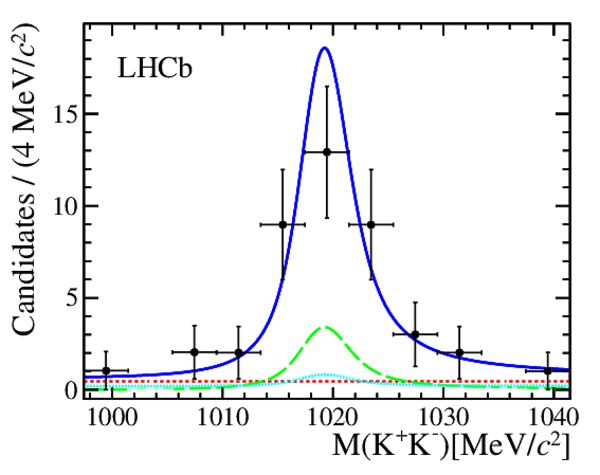
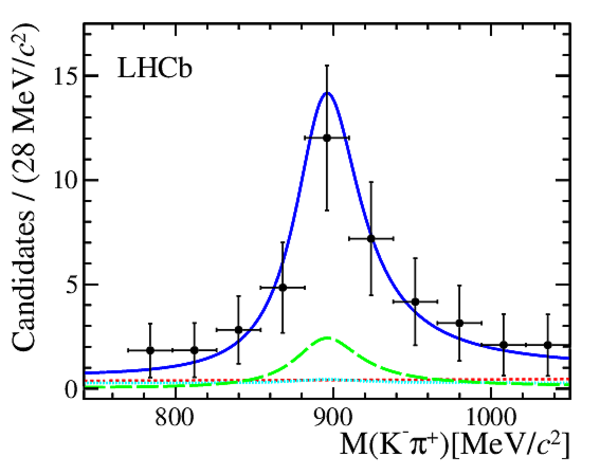
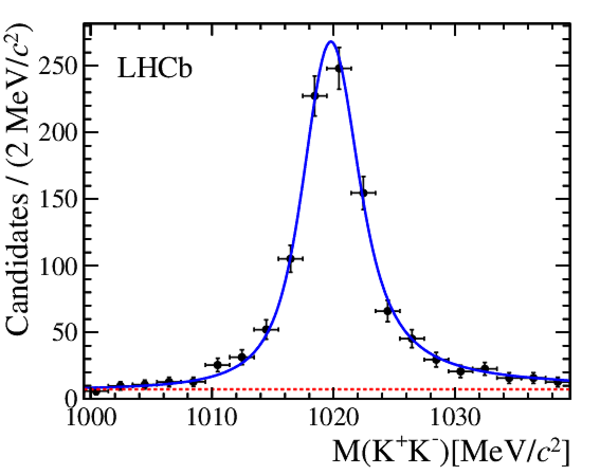
Invariant mass distributions for (left) $ K^+K^-$ and (right) $K^{\mp}\pi^{\pm}$ pairs in a $\pm 30 {\mathrm{ Me V /}c^2} $ window around the (top) $ B ^0_ s $ and (bottom) $ B ^0$ mass. The solid blue line is the overall fit, the green dashed line corresponds to $ B ^0$ cross-feed into the $ B ^0_ s $ mass window, the red dotted line is the {\rm S-wave} contribution and the light blue is the combinatorial background. |
masskkbs.pdf [18 KiB] HiDef png [204 KiB] Thumbnail [166 KiB] *.C file |
|
|
masskpibs.pdf [18 KiB] HiDef png [191 KiB] Thumbnail [157 KiB] *.C file |
|
|
|
masskkbd.pdf [16 KiB] HiDef png [193 KiB] Thumbnail [170 KiB] *.C file |
|
|
|
masskpibd.pdf [16 KiB] HiDef png [186 KiB] Thumbnail [162 KiB] *.C file |

|
|
|
Definition of the angles in $ B ^0_ s \rightarrow \phi \overline{ K }{} ^{*0} $ decays where $\theta_1$ ($\theta_2$) is the $K^+$ ($K^-$) emission angle with respect to the direction opposite to the $ B ^0_ s $ meson in the $\phi$ ( $\overline{ K }{} ^{*0}$ ) rest frame and $\varphi$ is the angle between the $\overline{ K }{} ^{*0}$ and $\phi$ decay planes in the $ B ^0_ s $ rest frame. |
angles_Bs.pdf [9 KiB] HiDef png [108 KiB] Thumbnail [71 KiB] *.C file |

|
|
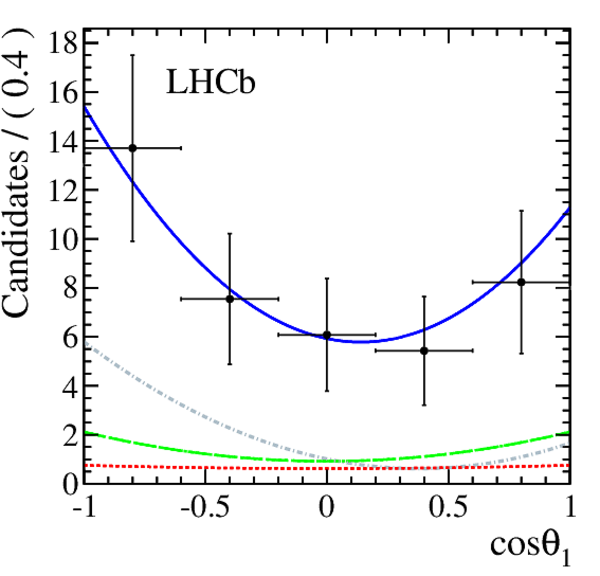
Result of the fit to the angular distribution of the $ B ^0_ s \rightarrow \phi \overline{ K }{} ^{*0} $ candidates in (left) $\cos\theta_1$ and (right) $\cos\theta_2$. The red dotted line corresponds to the combinatorial background under the $ B ^0_ s $ signal, the green dashed line is the $ B ^0 \rightarrow \phi K ^{*0} $ signal in the $ B ^0_ s $ region and the grey dotted-dashed line corresponds to the sum of the {\rm S-wave} and the interference terms. |
cth1.pdf [17 KiB] HiDef png [205 KiB] Thumbnail [166 KiB] *.C file |
|
|
cth2.pdf [17 KiB] HiDef png [208 KiB] Thumbnail [167 KiB] *.C file |

|
|
|
Animated gif made out of all figures. |
PAPER-2013-012.gif Thumbnail |

|
![HiDef png [198 KiB]](Directory_LHCb-PAPER-2013-012/hidef_penguinBphiKst.png)
![HiDef png [196 KiB]](Directory_LHCb-PAPER-2013-012/hidef_penguinBdPhiKst.png)
![HiDef png [856 KiB]](Directory_LHCb-PAPER-2013-012/hidef_four-body-mass.png)
![HiDef png [204 KiB]](Directory_LHCb-PAPER-2013-012/hidef_masskkbs.png)
![HiDef png [191 KiB]](Directory_LHCb-PAPER-2013-012/hidef_masskpibs.png)
![HiDef png [193 KiB]](Directory_LHCb-PAPER-2013-012/hidef_masskkbd.png)
![HiDef png [186 KiB]](Directory_LHCb-PAPER-2013-012/hidef_masskpibd.png)
![HiDef png [108 KiB]](Directory_LHCb-PAPER-2013-012/hidef_angles_Bs.png)
![HiDef png [205 KiB]](Directory_LHCb-PAPER-2013-012/hidef_cth1.png)
![HiDef png [208 KiB]](Directory_LHCb-PAPER-2013-012/hidef_cth2.png)
Tables and captions
|
Results of the fit to the sample of selected candidates. |
Table_1.pdf [52 KiB] HiDef png [67 KiB] Thumbnail [30 KiB] tex code |

|
|
Input values for the branching fraction computation. |
Table_2.pdf [73 KiB] HiDef png [58 KiB] Thumbnail [26 KiB] tex code |

|
|
Sources of systematic uncertainty in the branching fraction measurement. The total uncertainty is the addition in quadrature of the individual sources. |
Table_3.pdf [45 KiB] HiDef png [56 KiB] Thumbnail [25 KiB] tex code |

|
|
Systematic uncertainties of the angular parameters. |
Table_4.pdf [38 KiB] HiDef png [50 KiB] Thumbnail [22 KiB] tex code |

|
![HiDef png [67 KiB]](Directory_LHCb-PAPER-2013-012/hidef_Table_1.png)
![HiDef png [58 KiB]](Directory_LHCb-PAPER-2013-012/hidef_Table_2.png)
![HiDef png [56 KiB]](Directory_LHCb-PAPER-2013-012/hidef_Table_3.png)
![HiDef png [50 KiB]](Directory_LHCb-PAPER-2013-012/hidef_Table_4.png)
Created on 27 April 2024.