Production of $J/\psi$ and $\Upsilon$ mesons in $pp$ collisions at $\sqrt{s}$ = 8 TeV
[to restricted-access page]Information
LHCb-PAPER-2013-016
CERN-PH-EP-2013-071
arXiv:1304.6977 [PDF]
(Submitted on 25 Apr 2013)
JHEP 06 (2013) 64
Inspire 1230344
Tools
Abstract
The production of J/psi and Upsilon mesons in pp collisions at sqrt(s) = 8 TeV is studied with the LHCb detector. The J/psi and Upsilon mesons are reconstructed in the mu+mu- decay mode and the signal yields are determined with a fit to the mu+mu- invariant mass distributions. The analysis is performed in the rapidity range 2.0<y<4.5 and transverse momentum range 0<p_T<14(15) GeV/c of the J/psi(Upsilon) mesons. The J/psi and Upsilon production cross-sections and the fraction of J/psi mesons from b-hadron decays are measured as a function of the meson p_T and y.
Figures and captions
|
Projections of the fit result for a selected bin in $p_{\rm T}$ and $y$ for (a) the $ J/\psi$ invariant dimuon mass and (b) $t_z$. For the former, the total fitted function is shown (blue solid line) together with the signal distribution (red dotted line). In the $t_z$ projection the total fitted function is shown together with the $ J/\psi \mathrm{from} b $ component, the prompt signal, the background and the tail component due to the association of a $ J/\psi$ candidate with a wrong PV. |
Fig1a.pdf [19 KiB] HiDef png [205 KiB] Thumbnail [160 KiB] *.C file |

|
|
Fig1b.pdf [27 KiB] HiDef png [772 KiB] Thumbnail [323 KiB] *.C file |

|
|
|
Invariant mass distribution of the selected $\varUpsilon\rightarrow \mu^+\mu^-$ candidates in the range $ p_{\rm T} <15 {\mathrm{ Ge V /}c} $ and $2.0<y<4.5$. The three peaks correspond to the $\varUpsilon(1S)$, $\varUpsilon(2S)$ and $\varUpsilon(3S)$ meson signals (from left to right). The superimposed curve and the signal yields (dotted) are the result of the fit described in the text. |
Fig2.pdf [91 KiB] HiDef png [214 KiB] Thumbnail [147 KiB] *.C file |

|
|
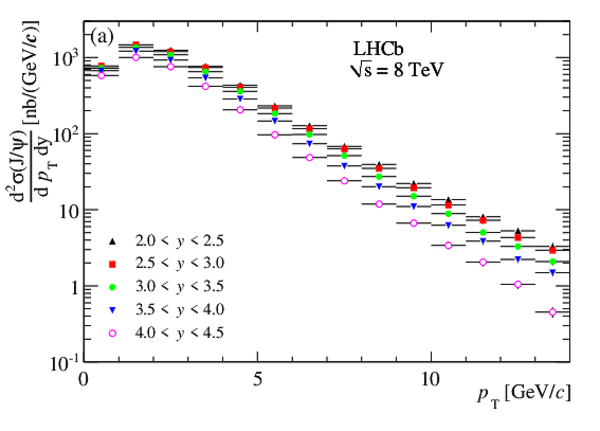
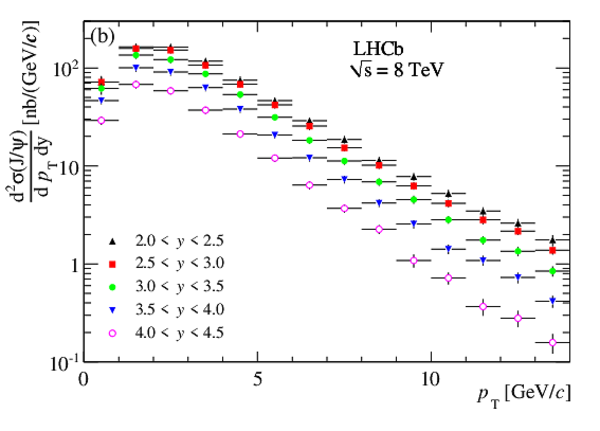
Differential production cross-section for (a) prompt $ J/\psi$ mesons and (b) $ J/\psi \mathrm{from} b $ as a function of $p_{\rm T}$ in bins of $y$. It is assumed that prompt $ J/\psi$ mesons are produced unpolarised. The errors are the quadratic sums of the statistical and systematic uncertainties. |
Fig3a.pdf [7 KiB] HiDef png [140 KiB] Thumbnail [138 KiB] *.C file |
|
|
Fig3b.pdf [8 KiB] HiDef png [144 KiB] Thumbnail [139 KiB] *.C file |
|
|
|
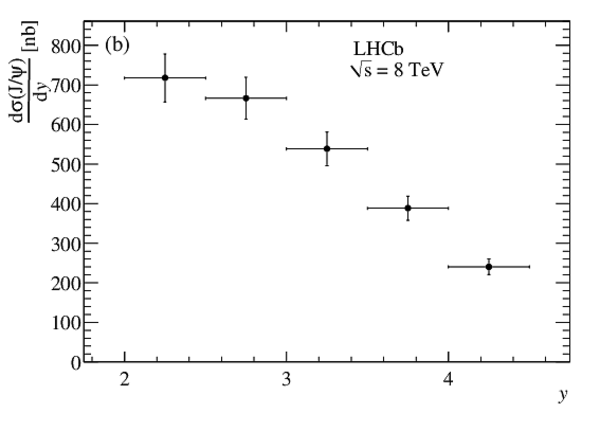
Differential production cross-section as a function of $y$ integrated over $p_{\rm T}$ , for (a) unpolarised $\mathrm{prompt} J/\psi$ mesons and (b) $ J/\psi \mathrm{from} b $ . The errors are the quadratic sums of the statistical and systematic uncertainties. |
Fig4a_[..].pdf [36 KiB] HiDef png [58 KiB] Thumbnail [22 KiB] *.C file |

|
|
Fig4b.pdf [4 KiB] HiDef png [65 KiB] Thumbnail [36 KiB] *.C file |
|
|
|
Fraction of $ J/\psi \mathrm{from} b $ as a function of $p_{\rm T}$ , in bins of $y$. |
Fig5.pdf [18 KiB] HiDef png [188 KiB] Thumbnail [182 KiB] *.C file |

|
|
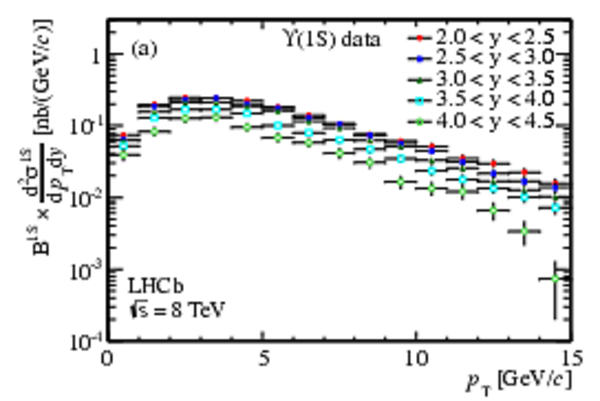
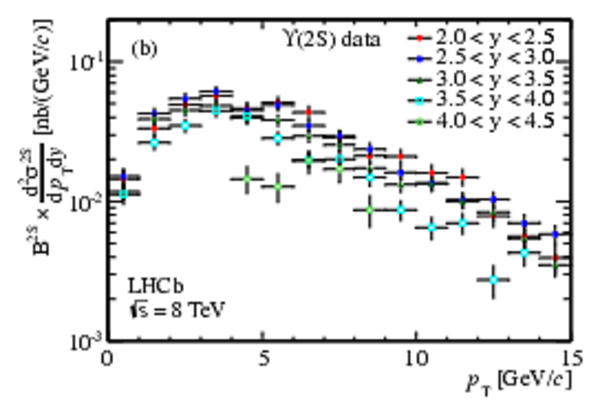
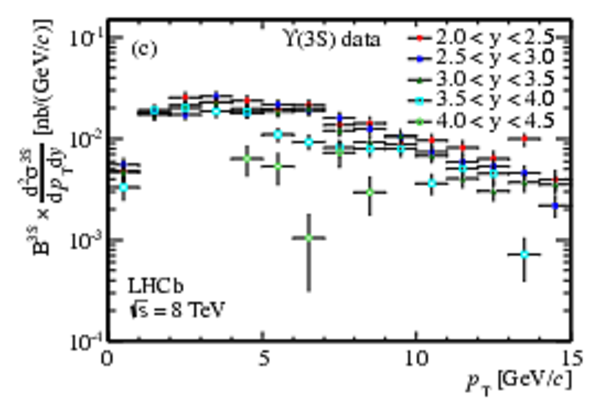
Double-differential cross-sections times dimuon branching fractions as a function of $p_{\rm T}$ in bins of $y$ for (a) the $\varUpsilon(1S)$, (b) $\varUpsilon(2S)$ and (c) $\varUpsilon(3S)$ mesons. |
Fig6a.pdf [54 KiB] HiDef png [232 KiB] Thumbnail [297 KiB] *.C file |
|
|
Fig6b.pdf [54 KiB] HiDef png [222 KiB] Thumbnail [294 KiB] *.C file |
|
|
|
Fig6c.pdf [54 KiB] HiDef png [225 KiB] Thumbnail [292 KiB] *.C file |
|
|
|
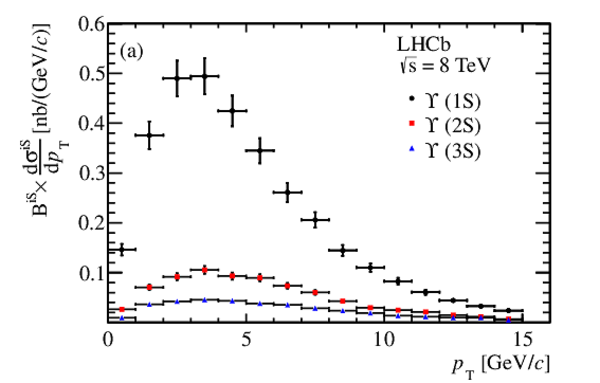
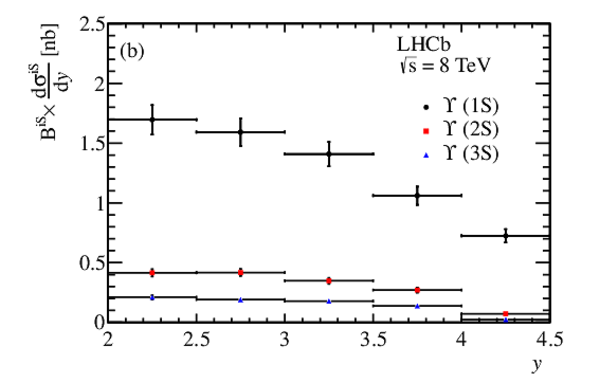
Differential production cross-sections for $\varUpsilon(1S)$, $\varUpsilon(2S)$ and $\varUpsilon(3S)$ mesons times dimuon branching fraction (a) as a function of $ p_{\rm T} $ integrated over $y$, and (b) as a function of $y$ integrated over $ p_{\rm T} $. |
Fig7a.pdf [17 KiB] HiDef png [125 KiB] Thumbnail [131 KiB] *.C file |
|
|
Fig7b.pdf [14 KiB] HiDef png [93 KiB] Thumbnail [96 KiB] *.C file |
|
|
|
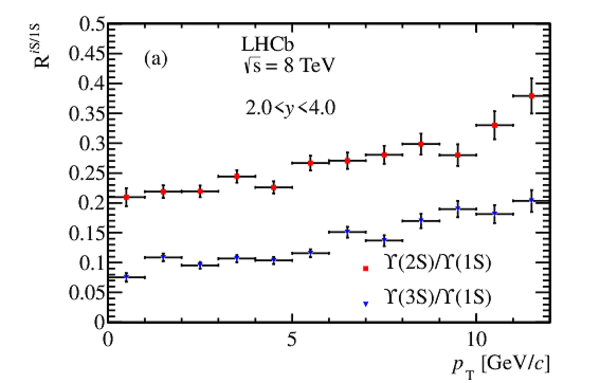
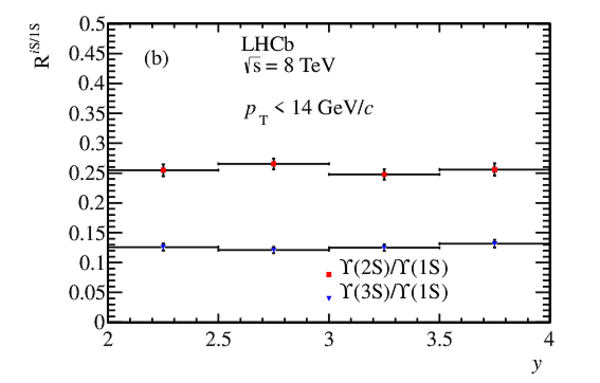
{\it } Ratio of the $\varUpsilon(2S)$ to $\varUpsilon(1S)$ and $\varUpsilon(3S)$ to $\varUpsilon(1S)$ cross-sections times dimuon branching fractions (a) as a function of $ p_{\rm T} $ integrated over $y$, and (b) as a function of $y$ integrated over $ p_{\rm T} $. |
Fig8a.pdf [16 KiB] HiDef png [133 KiB] Thumbnail [141 KiB] *.C file |
|
|
Fig8b.pdf [14 KiB] HiDef png [115 KiB] Thumbnail [121 KiB] *.C file |
|
|
|
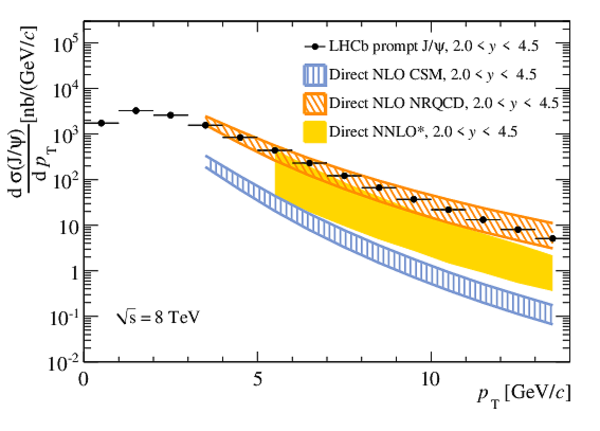
Comparison of the differential cross-section for the production of prompt $ J/\psi$ meson (under the assumption of zero polarisation) as a function of $ p_{\rm T} $ with direct production in an NLO NRQCD model [47,48] (orange diagonal shading), an NNLO* CSM [10] (solid yellow) and an NLO CSM [7] (blue vertical shading). The points show the measurements reported in this analysis. |
Fig9_g[..].pdf [14 KiB] HiDef png [319 KiB] Thumbnail [223 KiB] *.C file |
|
|
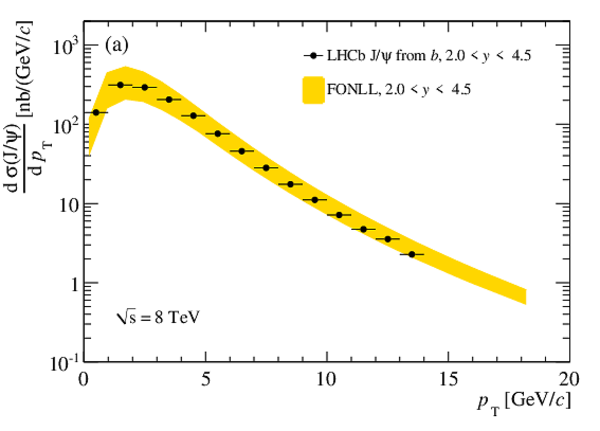
Differential production cross-section for $ J/\psi \mathrm{from} b $ (a) as a function of $p_{\rm T}$ in the fiducial range $2.0<y<4.5$, and (b) as a function of $y$ in the fiducial range $ p_{\rm T} <14 {\mathrm{ Ge V /}c} $. The FONLL prediction [46,50] is shown in yellow. The points show the measurements reported in this analysis. |
Fig10a.pdf [5 KiB] HiDef png [140 KiB] Thumbnail [127 KiB] *.C file |
|
|
Fig10b.pdf [4 KiB] HiDef png [130 KiB] Thumbnail [114 KiB] *.C file |

|
|
|
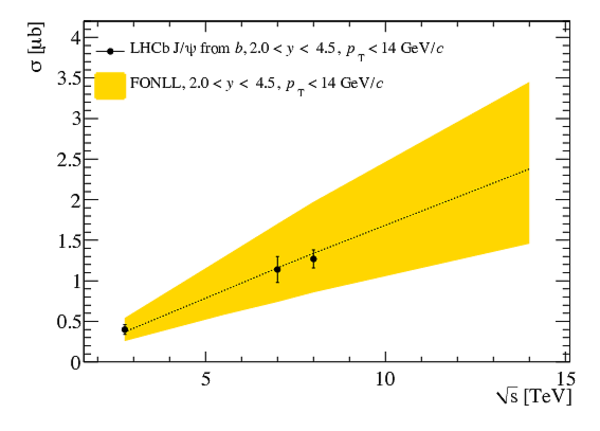
Predictions based on the FONLL formalism [46,50] for the production cross-section for $ J/\psi \mathrm{from} b $ in the fiducial range $0< p_{\rm T} <14 {\mathrm{ Ge V /}c} $ and $2.0<y<4.5$ (yellow band). The uncertainty includes contributions from the renormalisation scale, quark masses and the choice of PDF set. The black dotted line shows the central value of the prediction. The points show the LHCb measurements at $\sqrt{s}=2.76$ [14], 7 [12], and 8$ \mathrm{ Te V} $. |
Fig11.pdf [47 KiB] HiDef png [137 KiB] Thumbnail [116 KiB] *.C file |
|
|
Comparison of the differential production cross-sections times dimuon branching fractions for (a) $\varUpsilon(1S)$, (b) $\varUpsilon(2S)$ and (c) $\varUpsilon(3S)$ mesons as a function of $ p_{\rm T} $ with direct production in an NNLO$^*$ CSM [9] (solid yellow) and an NLO CSM [7] (blue vertical shading) model. The points show the measurements reported in this analysis. |
Fig12a.pdf [15 KiB] HiDef png [744 KiB] Thumbnail [245 KiB] *.C file |

|
|
Fig12b.pdf [15 KiB] HiDef png [750 KiB] Thumbnail [247 KiB] *.C file |

|
|
|
Fig12c.pdf [15 KiB] HiDef png [742 KiB] Thumbnail [244 KiB] *.C file |

|
|
|
Animated gif made out of all figures. |
PAPER-2013-016.gif Thumbnail |

|
![HiDef png [205 KiB]](Directory_LHCb-PAPER-2013-016/hidef_Fig1a.png)
![HiDef png [772 KiB]](Directory_LHCb-PAPER-2013-016/hidef_Fig1b.png)
![HiDef png [214 KiB]](Directory_LHCb-PAPER-2013-016/hidef_Fig2.png)
![HiDef png [140 KiB]](Directory_LHCb-PAPER-2013-016/hidef_Fig3a.png)
![HiDef png [144 KiB]](Directory_LHCb-PAPER-2013-016/hidef_Fig3b.png)
![HiDef png [58 KiB]](Directory_LHCb-PAPER-2013-016/hidef_Fig4a_giulia1.png)
![HiDef png [65 KiB]](Directory_LHCb-PAPER-2013-016/hidef_Fig4b.png)
![HiDef png [188 KiB]](Directory_LHCb-PAPER-2013-016/hidef_Fig5.png)
![HiDef png [232 KiB]](Directory_LHCb-PAPER-2013-016/hidef_Fig6a.png)
![HiDef png [222 KiB]](Directory_LHCb-PAPER-2013-016/hidef_Fig6b.png)
![HiDef png [225 KiB]](Directory_LHCb-PAPER-2013-016/hidef_Fig6c.png)
![HiDef png [125 KiB]](Directory_LHCb-PAPER-2013-016/hidef_Fig7a.png)
![HiDef png [93 KiB]](Directory_LHCb-PAPER-2013-016/hidef_Fig7b.png)
![HiDef png [133 KiB]](Directory_LHCb-PAPER-2013-016/hidef_Fig8a.png)
![HiDef png [115 KiB]](Directory_LHCb-PAPER-2013-016/hidef_Fig8b.png)
![HiDef png [319 KiB]](Directory_LHCb-PAPER-2013-016/hidef_Fig9_giulia.png)
![HiDef png [140 KiB]](Directory_LHCb-PAPER-2013-016/hidef_Fig10a.png)
![HiDef png [130 KiB]](Directory_LHCb-PAPER-2013-016/hidef_Fig10b.png)
![HiDef png [137 KiB]](Directory_LHCb-PAPER-2013-016/hidef_Fig11.png)
![HiDef png [744 KiB]](Directory_LHCb-PAPER-2013-016/hidef_Fig12a.png)
![HiDef png [750 KiB]](Directory_LHCb-PAPER-2013-016/hidef_Fig12b.png)
![HiDef png [742 KiB]](Directory_LHCb-PAPER-2013-016/hidef_Fig12c.png)
Tables and captions
|
Selection criteria for the $ J/\psi$ and $\varUpsilon$ meson analyses. Criteria common to both analyses are displayed between the two columns. |
Table_1.pdf [49 KiB] HiDef png [47 KiB] Thumbnail [20 KiB] tex code |

|
|
Relative systematic uncertainties (in %) on the $ J/\psi$ and $\varUpsilon$ cross-section results and on the fraction of $ J/\psi \mathrm{from} b $ . |
Table_2.pdf [65 KiB] HiDef png [135 KiB] Thumbnail [56 KiB] tex code |

|
|
Differential production cross-section ${\rm d}\sigma/{\rm d}y$ in nb for $\mathrm{prompt} J/\psi$ mesons (assumed unpolarised) and for $ J/\psi \mathrm{from} b $ , integrated over $p_{\rm T}$ . The first uncertainty is statistical, the second (third) is the part of the systematic uncertainty that is uncorrelated (correlated) between bins. |
Table_3.pdf [29 KiB] HiDef png [72 KiB] Thumbnail [37 KiB] tex code |

|
|
Double-differential cross-section $\frac{{\rm d}^2\sigma}{{\rm d}p_{\rm T}{\rm d}y}$ in nb/( $ {\mathrm{ Ge V /}c}$ ) for prompt $ J/\psi$ meson production in bins of of $p_{\rm T}$ and $y$, with the assumption of no polarisation. The first error is statistical, the second is the component of the systematic uncertainty that is uncorrelated between bins and the third is the correlated component. |
Table_4.pdf [36 KiB] HiDef png [232 KiB] Thumbnail [109 KiB] tex code |

|
|
Double-differential cross-section $\frac{{\rm d}^2\sigma}{{\rm d}p_{\rm T}{\rm d}y}$ in nb/( $ {\mathrm{ Ge V /}c}$ ) for the production of $ J/\psi \mathrm{from} b $ in bins of $p_{\rm T}$ and $y$. The first error is statistical, the second is the component of the systematic uncertainty that is uncorrelated between bins and the third is the correlated component. |
Table_5.pdf [36 KiB] HiDef png [246 KiB] Thumbnail [122 KiB] tex code |

|
|
Fraction of $ J/\psi \mathrm{from} b $ (in %) in bins of of $p_{\rm T}$ and $y$. The first uncertainty is statistical and the second systematic (uncorrelated between bins). |
Table_6.pdf [35 KiB] HiDef png [232 KiB] Thumbnail [145 KiB] tex code |

|
|
Double-differential production cross-sections $\frac{{\rm d}^2\sigma}{{\rm d}p_{\rm T}{\rm d}y}\times \mathcal{B}^{1S}$ in pb/( $ {\mathrm{ Ge V /}c}$ ) for the $\varUpsilon(1S)$ meson in bins of transverse momentum and rapidity, assuming no polarisation. The first error is statistical, the second is the component of the systematic uncertainty that is uncorrelated between bins and the third is the correlated component. |
Table_7.pdf [36 KiB] HiDef png [223 KiB] Thumbnail [116 KiB] tex code |

|
|
Double-differential production cross-sections $\frac{{\rm d}^2\sigma}{{\rm d}p_{\rm T}{\rm d}y}\times \mathcal{B}^{2S}$ in pb/( $ {\mathrm{ Ge V /}c}$ ) for the $\varUpsilon(2S)$ meson in bins of transverse momentum and rapidity, assuming no polarisation. The first error is statistical, the second is the component of the systematic uncertainty that is uncorrelated between bins and the third is the correlated component. Regions where the number of events was not large enough to perform a measurement are indicated with a dash. |
Table_8.pdf [36 KiB] HiDef png [203 KiB] Thumbnail [96 KiB] tex code |

|
|
Double-differential production cross-sections $\frac{{\rm d}^2\sigma}{{\rm d}p_{\rm T}{\rm d}y}\times \mathcal{B}^{3S}$ in pb/( $ {\mathrm{ Ge V /}c}$ ) for the $\varUpsilon(3S)$ meson in bins of transverse momentum and rapidity, assuming no polarisation. The first error is statistical, the second is the component of the systematic uncertainty that is uncorrelated between bins and the third is the correlated component. Regions where the number of events was not large enough to perform a measurement are indicated with a dash. |
Table_9.pdf [36 KiB] HiDef png [197 KiB] Thumbnail [92 KiB] tex code |

|
|
Ratios of cross-sections $\varUpsilon(2S)\rightarrow\mu^+\mu^-$ and $\varUpsilon(3S)\rightarrow\mu^+\mu^-$ with respect to {$\varUpsilon(1S)\rightarrow\mu^+\mu^-$} as a function of $ p_{\rm T} $ in the range $2.0<y<4.0$, assuming no polarisation. The first error is statistical, the second is the component of the systematic uncertainty that is uncorrelated between bins and the third is the correlated component. |
Table_10.pdf [43 KiB] HiDef png [156 KiB] Thumbnail [77 KiB] tex code |

|
|
Ratios of cross-sections $\varUpsilon(2S)\rightarrow\mu^+\mu^-$ and $\varUpsilon(3S)\rightarrow\mu^+\mu^-$ with respect to {$\varUpsilon(1S)\rightarrow\mu^+\mu^-$} as a function of $y$ in the range $2.0<y<4.0$, assuming no polarisation. The first error is statistical, the second is the component of the systematic uncertainty that is uncorrelated between bins and the third is the correlated component. |
Table_11.pdf [41 KiB] HiDef png [56 KiB] Thumbnail [25 KiB] tex code |

|
![HiDef png [47 KiB]](Directory_LHCb-PAPER-2013-016/hidef_Table_1.png)
![HiDef png [135 KiB]](Directory_LHCb-PAPER-2013-016/hidef_Table_2.png)
![HiDef png [72 KiB]](Directory_LHCb-PAPER-2013-016/hidef_Table_3.png)
![HiDef png [232 KiB]](Directory_LHCb-PAPER-2013-016/hidef_Table_4.png)
![HiDef png [246 KiB]](Directory_LHCb-PAPER-2013-016/hidef_Table_5.png)
![HiDef png [232 KiB]](Directory_LHCb-PAPER-2013-016/hidef_Table_6.png)
![HiDef png [223 KiB]](Directory_LHCb-PAPER-2013-016/hidef_Table_7.png)
![HiDef png [203 KiB]](Directory_LHCb-PAPER-2013-016/hidef_Table_8.png)
![HiDef png [197 KiB]](Directory_LHCb-PAPER-2013-016/hidef_Table_9.png)
![HiDef png [156 KiB]](Directory_LHCb-PAPER-2013-016/hidef_Table_10.png)
![HiDef png [56 KiB]](Directory_LHCb-PAPER-2013-016/hidef_Table_11.png)
Supplementary Material [file]
|
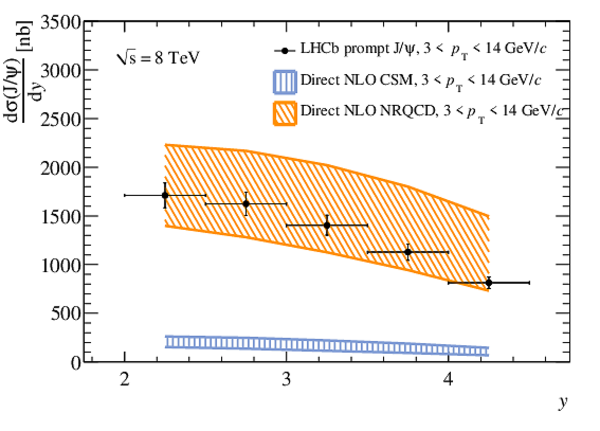
This ZIP file contains supplemetary material for the publication LHCb-PAPER-2013-016. The files are the three formats of the Figure 13, whose description is below. Fig.13: Comparison of the differential cross-section for the production of prompt J/psi as a function of y with direct production in a NLO NRQCD model |
Fig13.pdf [5 KiB] HiDef png [470 KiB] Thumbnail [281 KiB] *C file |
|
![HiDef png [470 KiB]](Directory_LHCb-PAPER-2013-016/supplementary/hidef_Fig13.png)
Created on 26 April 2024.