Differential branching fraction and angular analysis of the decay $B_s^0 \to \phi \mu^+\mu^-$
[to restricted-access page]Information
LHCb-PAPER-2013-017
CERN-PH-EP-2013-078
arXiv:1305.2168 [PDF]
(Submitted on 09 May 2013)
JHEP 07 (2013) 84
Inspire 1232507
Tools
Abstract
The determination of the differential branching fraction and the first angular analysis of the decay $B_s^0\to\phi\mu^{+}\mu^{-}$ are presented using data, corresponding to an integrated luminosity of $1.0 {\rm fb}^{-1}$, collected by the LHCb experiment at $\sqrt{s}=7 {\rm TeV}$. The differential branching fraction is determined in bins of $q^{2}$, the invariant dimuon mass squared. Integration over the full $q^{2}$ range yields a total branching fraction of ${\cal B}(B_s^0\to\phi\mu^{+}\mu^{-}) = (7.07 ^{+0.64}_{-0.59}\pm 0.17 \pm 0.71)\times 10^{-7}$, where the first uncertainty is statistical, the second systematic, and the third originates from the branching fraction of the normalisation channel. An angular analysis is performed to determine the angular observables $F_{\rm L}$, $S_3$, $A_6$, and $A_9$. The observables are consistent with Standard Model expectations.
Figures and captions
|
Invariant $\mu ^+ \mu ^- $ versus $ K ^+ K ^- \mu ^+ \mu ^- $ mass. The charmonium vetoes are indicated by the solid lines. The vertical dashed lines indicate the signal region of $\pm50 {\mathrm{ Me V /}c^2} $ around the known $ B ^0_ s $ mass in which the signal decay $ B ^0_ s \rightarrow \phi\mu ^+ \mu ^- $ is visible. |
Fig1.pdf [18 KiB] HiDef png [272 KiB] Thumbnail [248 KiB] *.C file |

|
|
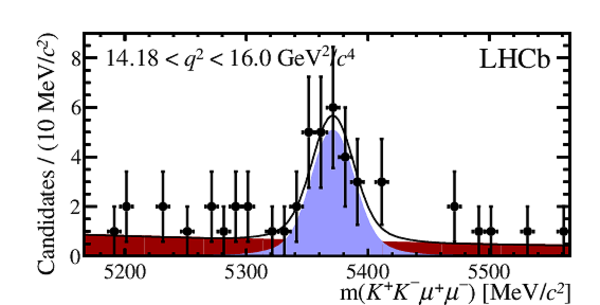
Invariant mass of $ B ^0_ s \rightarrow \phi\mu ^+ \mu ^- $ candidates in six bins of invariant dimuon mass squared. The fitted signal component is denoted by the light blue shaded area, the combinatorial background component by the dark red shaded area. The solid line indicates the sum of the signal and background components. |
Fig2a.pdf [13 KiB] HiDef png [143 KiB] Thumbnail [130 KiB] *.C file |

|
|
Fig2b.pdf [15 KiB] HiDef png [154 KiB] Thumbnail [144 KiB] *.C file |

|
|
|
Fig2c.pdf [15 KiB] HiDef png [152 KiB] Thumbnail [135 KiB] *.C file |

|
|
|
Fig2d.pdf [14 KiB] HiDef png [160 KiB] Thumbnail [146 KiB] *.C file |

|
|
|
Fig2e.pdf [14 KiB] HiDef png [158 KiB] Thumbnail [146 KiB] *.C file |
|
|
|
Fig2f.pdf [13 KiB] HiDef png [146 KiB] Thumbnail [129 KiB] *.C file |

|
|
|
Differential branching fraction ${\rm d}{\cal B}( B ^0_ s \rightarrow \phi\mu ^+ \mu ^- )/{\rm d}q^2$. Error bars include both statistical and systematic uncertainties added in quadrature. Shaded areas indicate the vetoed regions containing the $ { J \mskip -3mu/\mskip -2mu\psi \mskip 2mu} $ and $\psi {(2S)} $ resonances. The solid curve shows the leading order SM prediction, scaled to the fitted total branching fraction. The prediction uses the SM Wilson coefficients and leading order amplitudes given in Ref. [2], as well as the form factor calculations in Ref. [17]. $ B ^0_ s $ mixing is included as described in Ref. [1]. No error band is given for the theory prediction. The dashed curve denotes the leading order prediction scaled to a total branching fraction of $16\times 10^{-7}$ [19]. |
Fig3.pdf [22 KiB] HiDef png [161 KiB] Thumbnail [116 KiB] *.C file |

|
|
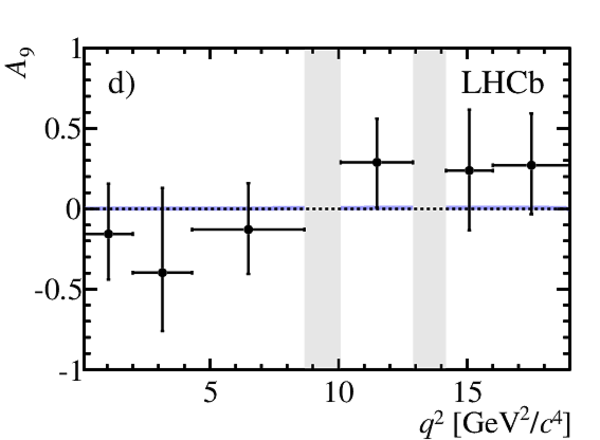
a) Longitudinal polarisation fraction $F_{\rm L}$, b) $S_3$, c) $A_6$, and d) $A_9$ in six bins of $q^2$. Error bars include statistical and systematic uncertainties added in quadrature. The solid curves are the leading order SM predictions, using the Wilson coefficients and leading order amplitudes given in Ref. [2], as well as the form factor calculations in Ref. [17]. $ B ^0_ s $ mixing is included as described in Ref. [1]. No error band is given for the theory predictions. |
Fig4a.pdf [16 KiB] HiDef png [126 KiB] Thumbnail [106 KiB] *.C file |

|
|
Fig4b.pdf [13 KiB] HiDef png [116 KiB] Thumbnail [96 KiB] *.C file |

|
|
|
Fig4c.pdf [11 KiB] HiDef png [110 KiB] Thumbnail [90 KiB] *.C file |

|
|
|
Fig4d.pdf [11 KiB] HiDef png [111 KiB] Thumbnail [92 KiB] *.C file |
|
|
|
Animated gif made out of all figures. |
PAPER-2013-017.gif Thumbnail |

|
![HiDef png [272 KiB]](Directory_LHCb-PAPER-2013-017/hidef_Fig1.png)
![HiDef png [143 KiB]](Directory_LHCb-PAPER-2013-017/hidef_Fig2a.png)
![HiDef png [154 KiB]](Directory_LHCb-PAPER-2013-017/hidef_Fig2b.png)
![HiDef png [152 KiB]](Directory_LHCb-PAPER-2013-017/hidef_Fig2c.png)
![HiDef png [160 KiB]](Directory_LHCb-PAPER-2013-017/hidef_Fig2d.png)
![HiDef png [158 KiB]](Directory_LHCb-PAPER-2013-017/hidef_Fig2e.png)
![HiDef png [146 KiB]](Directory_LHCb-PAPER-2013-017/hidef_Fig2f.png)
![HiDef png [161 KiB]](Directory_LHCb-PAPER-2013-017/hidef_Fig3.png)
![HiDef png [126 KiB]](Directory_LHCb-PAPER-2013-017/hidef_Fig4a.png)
![HiDef png [116 KiB]](Directory_LHCb-PAPER-2013-017/hidef_Fig4b.png)
![HiDef png [110 KiB]](Directory_LHCb-PAPER-2013-017/hidef_Fig4c.png)
![HiDef png [111 KiB]](Directory_LHCb-PAPER-2013-017/hidef_Fig4d.png)
Tables and captions
|
Signal yield and differential branching fraction ${\rm d}{\cal B}( B ^0_ s \rightarrow \phi\mu ^+ \mu ^- )/{\rm d}q^2$ in six bins of $q^2$. Results are also quoted for the region $1<q^2<6 {\mathrm{ Ge V /}c^2} $ where theoretical predictions are most reliable. The first uncertainty is statistical, the second systematic, and the third from the branching fraction of the normalisation channel. |
Table_1.pdf [53 KiB] HiDef png [115 KiB] Thumbnail [57 KiB] tex code |

|
|
Results for the angular observables $F_{\rm L}$, $S_3$, $A_6$, and $A_9$ in bins of $q^2$. The first uncertainty is statistical, the second systematic. |
Table_2.pdf [50 KiB] HiDef png [88 KiB] Thumbnail [42 KiB] tex code |

|
![HiDef png [115 KiB]](Directory_LHCb-PAPER-2013-017/hidef_Table_1.png)
![HiDef png [88 KiB]](Directory_LHCb-PAPER-2013-017/hidef_Table_2.png)
Created on 27 April 2024.