Differential branching fraction and angular analysis of the decay $B^{0} \rightarrow K^{*0} \mu^{+}\mu^{-}$
[to restricted-access page]Information
LHCb-PAPER-2013-019
CERN-PH-EP-2013-074
arXiv:1304.6325 [PDF]
(Submitted on 23 Apr 2013)
JHEP 08 (2013) 131
Inspire 1229504
Tools
Abstract
The angular distribution and differential branching fraction of the decay $B^{0} \to K^{*0} \mu^{+}\mu^{-}$ are studied using a data sample, collected by the LHCb experiment in $pp$ collisions at $\sqrt{s}=7 {\rm TeV}$, corresponding to an integrated luminosity of $1.0 {\rm fb}^{-1}$. Several angular observables are measured in bins of the dimuon invariant mass squared, $q^{2}$. A first measurement of the zero-crossing point of the forward-backward asymmetry of the dimuon system is also presented. The zero-crossing point is measured to be $q_{0}^{2} = 4.9 \pm 0.9 {\rm GeV}^{2}/c^{4}$, where the uncertainty is the sum of statistical and systematic uncertainties. The results are consistent with the Standard Model predictions.
Figures and captions
|
Distribution of $\mu ^+\mu ^- $ versus $ K ^+ \pi ^- \mu ^+\mu ^- $ invariant mass of selected $ B ^0 \rightarrow K ^{*0} \mu ^+\mu ^- $ candidates. The vertical lines indicate a $\pm 50 {\mathrm{ Me V /}c^2} $ signal mass window around the nominal $ B ^0$ mass. The horizontal lines indicate the two veto regions that are used to remove $ { J \mskip -3mu/\mskip -2mu\psi \mskip 2mu}$ and $\psi {(2S)} \rightarrow \mu ^+\mu ^- $ decays. The $ B ^0 \rightarrow K ^{*0} \mu ^+\mu ^- $ signal is clearly visible outside of the $ { J \mskip -3mu/\mskip -2mu\psi \mskip 2mu}$ and $\psi {(2S)} \rightarrow \mu ^+\mu ^- $ windows. |
plot2D.pdf [24 KiB] HiDef png [287 KiB] Thumbnail [336 KiB] *.C file |

|
|
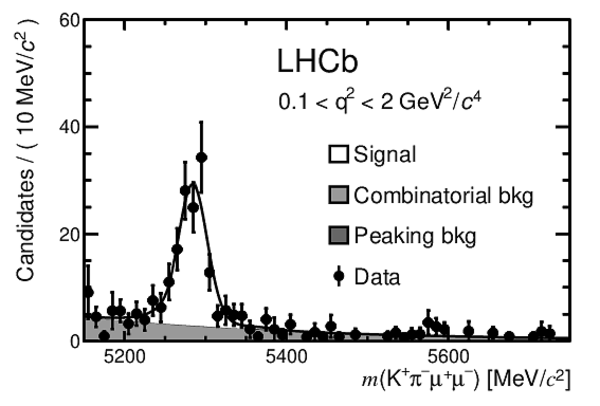
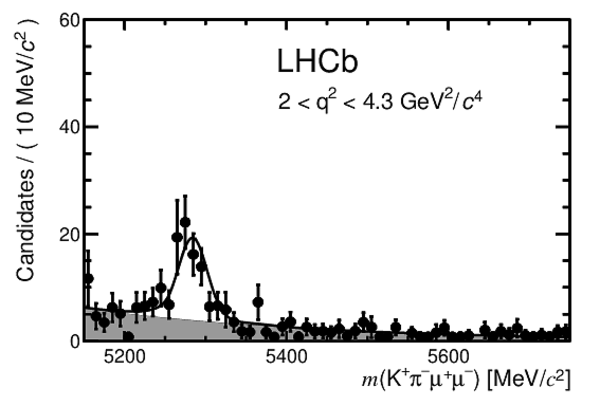
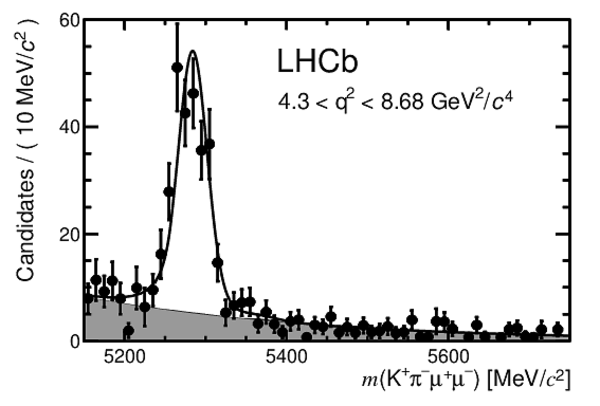
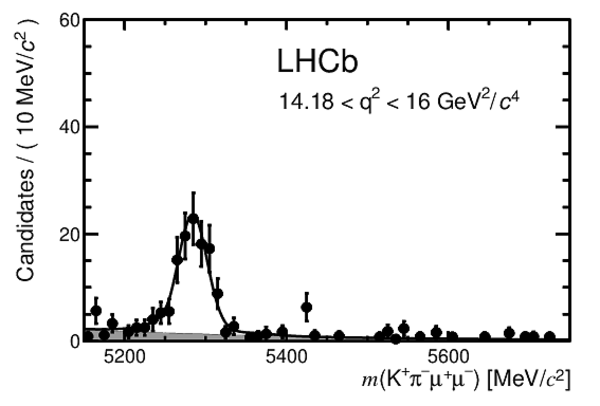
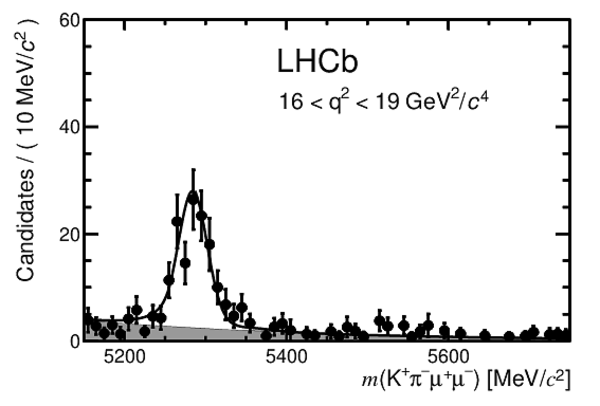
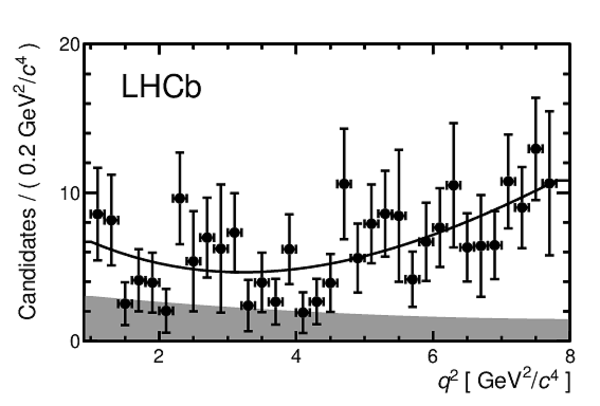
Invariant mass distributions of $ K ^+ \pi ^- \mu ^+\mu ^- $ candidates in the six $ q^2$ bins used in the analysis. The candidates have been weighted to account for the detector acceptance (see text). Contributions from exclusive (peaking) backgrounds are negligible after applying the vetoes described in Sec. 4. |
mass0.pdf [20 KiB] HiDef png [134 KiB] Thumbnail [72 KiB] *.C file |
|
|
mass1.pdf [21 KiB] HiDef png [108 KiB] Thumbnail [58 KiB] *.C file |
|
|
|
mass2.pdf [21 KiB] HiDef png [126 KiB] Thumbnail [68 KiB] *.C file |
|
|
|
mass3.pdf [20 KiB] HiDef png [117 KiB] Thumbnail [64 KiB] *.C file |

|
|
|
mass4.pdf [19 KiB] HiDef png [99 KiB] Thumbnail [53 KiB] *.C file |
|
|
|
mass5.pdf [20 KiB] HiDef png [108 KiB] Thumbnail [58 KiB] *.C file |
|
|
|
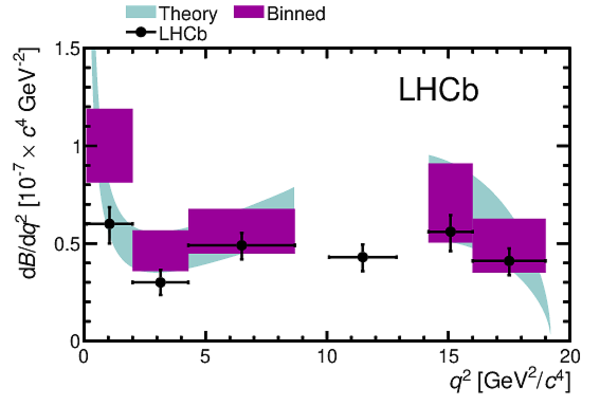
Differential branching fraction of the $ B ^0 \rightarrow K ^{*0} \mu ^+\mu ^- $ decay as a function of the dimuon invariant mass squared. The data are overlaid with a SM prediction (see text) for the decay (light-blue band). A rate average of the SM prediction across each $ q^2$ bin is indicated by the dark (purple) rectangular regions. No SM prediction is included in the region close to the narrow $ c \overline c $ resonances. |
cWidth.pdf [18 KiB] HiDef png [130 KiB] Thumbnail [110 KiB] *.C file |
|
|
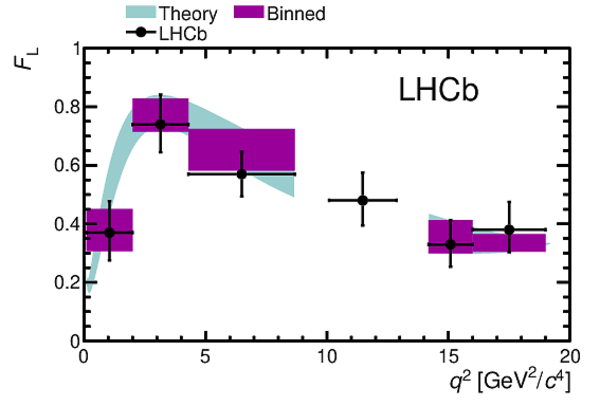
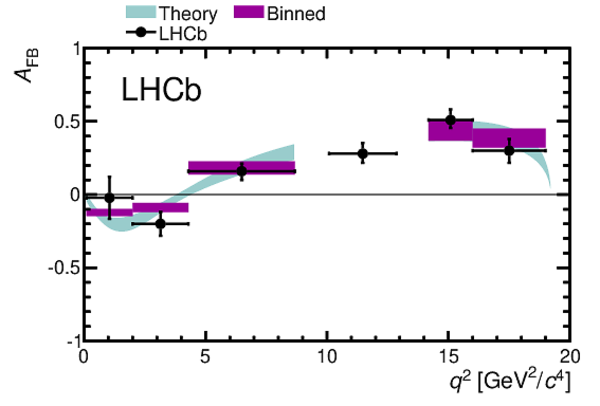
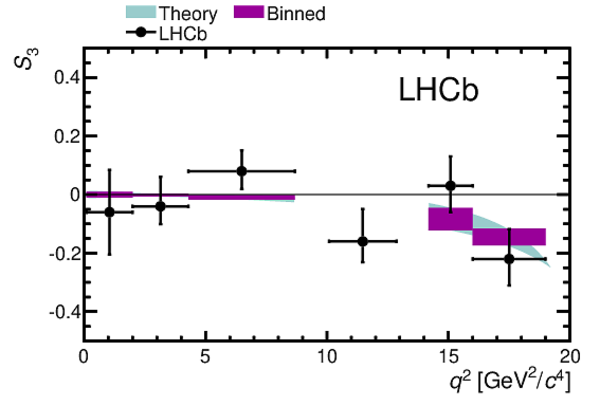
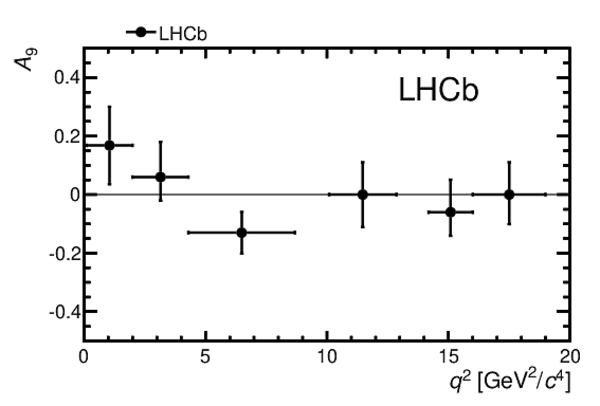
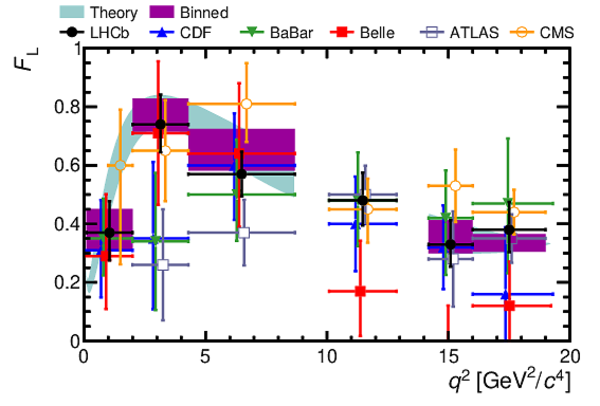
Fraction of longitudinal polarisation of the $ K ^{*0}$ , $F_{\rm L}$, dimuon system forward-backward asymmetry, $A_{\rm FB}$ and the angular observables $S_3$ and $A_9$ from the $ B ^0 \rightarrow K ^{*0} \mu ^+\mu ^- $ decay as a function of the dimuon invariant mass squared, $ q^2$ . The lowest $ q^2$ bin has been corrected for the threshold behaviour described in Sec. 7.2. The experimental data points overlay the SM prediction described in the text. A rate average of the SM prediction across each $ q^2$ bin is indicated by the dark (purple) rectangular regions. No theory prediction is included for $A_9$, which is vanishingly small in the SM. |
cFL.pdf [18 KiB] HiDef png [117 KiB] Thumbnail [98 KiB] *.C file |
|
|
cAFB.pdf [17 KiB] HiDef png [105 KiB] Thumbnail [93 KiB] *.C file |
|
|
|
cS3.pdf [17 KiB] HiDef png [98 KiB] Thumbnail [90 KiB] *.C file |
|
|
|
cA9.pdf [14 KiB] HiDef png [54 KiB] Thumbnail [31 KiB] *.C file |
|
|
|
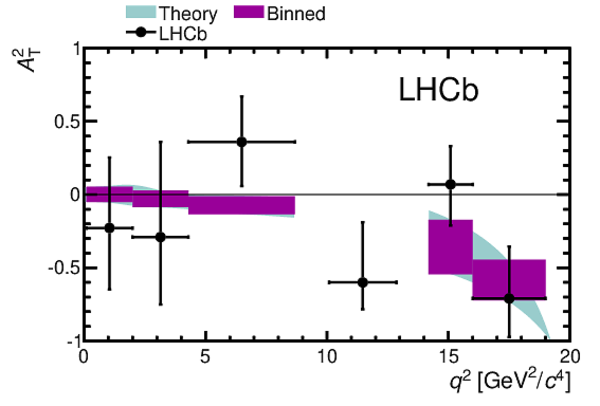
Transverse asymmetries $A_{\rm T}^{2}$ and $A_{\rm T}^{\rm Re}$ as a function of the dimuon invariant mass squared, $ q^2$ , in the $ B ^0 \rightarrow K ^{*0} \mu ^+\mu ^- $ decay. The lowest $ q^2$ bin has been corrected for the threshold behaviour described in Sec. 7.2. The experimental data points overlay the SM prediction that is described in the text. A rate average of the SM prediction across each $ q^2$ bin is indicated by the dark (purple) rectangular regions. |
cAT2.pdf [17 KiB] HiDef png [105 KiB] Thumbnail [94 KiB] *.C file |
|
|
cATRE.pdf [19 KiB] HiDef png [129 KiB] Thumbnail [106 KiB] *.C file |

|
|
|
Dimuon invariant mass squared, $ q^2$ , distribution of forward-going (left) and backward-going (right) candidates in the $ K ^+ \pi ^- \mu ^+\mu ^- $ invariant mass window $5230 < m( K ^+ \pi ^- \mu ^+\mu ^- ) < 5330 {\mathrm{ Me V /}c^2} $. The polynomial fit to the signal and background distributions in $ q^2$ is overlaid. |
forward.pdf [17 KiB] HiDef png [112 KiB] Thumbnail [65 KiB] *.C file |
|
|
backward.pdf [17 KiB] HiDef png [118 KiB] Thumbnail [68 KiB] *.C file |

|
|
|
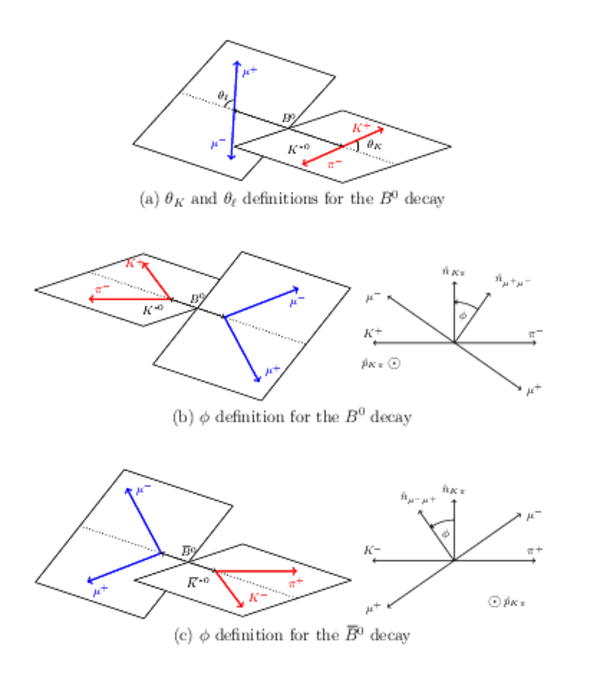
Graphical representation of the angular basis used for $ B ^0 \rightarrow K ^{*0} \mu ^+\mu ^- $ and $\overline{ B }{} ^0 \rightarrow \overline{ K }{} ^{*0} \mu ^+\mu ^- $ decays in this paper. The notation $\hat{n}_{ab}$ is used to represent the normal to the plane containing particles $a$ and $b$ in the $ B ^0 $ (or $\overline{ B }{} ^0$ ) rest frame. An explicit description of the angular basis is given in the text. |
anglephi.pdf [88 KiB] HiDef png [258 KiB] Thumbnail [211 KiB] *.C file |
|
|
Animated gif made out of all figures. |
PAPER-2013-019.gif Thumbnail |

|
![HiDef png [287 KiB]](Directory_LHCb-PAPER-2013-019/hidef_plot2D.png)
![HiDef png [134 KiB]](Directory_LHCb-PAPER-2013-019/hidef_mass0.png)
![HiDef png [108 KiB]](Directory_LHCb-PAPER-2013-019/hidef_mass1.png)
![HiDef png [126 KiB]](Directory_LHCb-PAPER-2013-019/hidef_mass2.png)
![HiDef png [117 KiB]](Directory_LHCb-PAPER-2013-019/hidef_mass3.png)
![HiDef png [99 KiB]](Directory_LHCb-PAPER-2013-019/hidef_mass4.png)
![HiDef png [108 KiB]](Directory_LHCb-PAPER-2013-019/hidef_mass5.png)
![HiDef png [130 KiB]](Directory_LHCb-PAPER-2013-019/hidef_cWidth.png)
![HiDef png [117 KiB]](Directory_LHCb-PAPER-2013-019/hidef_cFL.png)
![HiDef png [105 KiB]](Directory_LHCb-PAPER-2013-019/hidef_cAFB.png)
![HiDef png [98 KiB]](Directory_LHCb-PAPER-2013-019/hidef_cS3.png)
![HiDef png [54 KiB]](Directory_LHCb-PAPER-2013-019/hidef_cA9.png)
![HiDef png [105 KiB]](Directory_LHCb-PAPER-2013-019/hidef_cAT2.png)
![HiDef png [129 KiB]](Directory_LHCb-PAPER-2013-019/hidef_cATRE.png)
![HiDef png [112 KiB]](Directory_LHCb-PAPER-2013-019/hidef_forward.png)
![HiDef png [118 KiB]](Directory_LHCb-PAPER-2013-019/hidef_backward.png)
![HiDef png [258 KiB]](Directory_LHCb-PAPER-2013-019/hidef_anglephi.png)
Tables and captions
|
Signal yield ($N_{\text{sig}}$) and differential branching fraction ($\mathrm{d}\cal B /\mathrm{d} q^2 $) of the $ B ^0 \rightarrow K ^{*0} \mu ^+\mu ^- $ decay in the six $ q^2$ bins used in this analysis. Results are also presented in the $1 < q^2 < 6\mathrm{ Ge V} ^{2}/c^{4}$ range where theoretical uncertainties are best controlled. The first and second uncertainties are statistical and systematic. The third uncertainty comes from the uncertainty on the $ B ^0 \rightarrow K ^{*0} { J \mskip -3mu/\mskip -2mu\psi \mskip 2mu} $ and $ { J \mskip -3mu/\mskip -2mu\psi \mskip 2mu} \rightarrow \mu ^+\mu ^- $ branching fractions. The final uncertainty on $\mathrm{d}\cal B /\mathrm{d} q^2 $ comes from an estimate of the pollution from non- $ K ^{*0}$ $ B ^0 \rightarrow K ^+ \pi ^- \mu ^+\mu ^- $ decays in the $792 < m({ K ^+ \pi ^- }) < 992 {\mathrm{ Me V /}c^2} $ mass window (see Sec. 7.3.2). |
Table_1.pdf [51 KiB] HiDef png [105 KiB] Thumbnail [56 KiB] tex code |

|
|
Fraction of longitudinal polarisation of the $ K ^{*0}$ , $F_{\rm L}$, dimuon system forward-backward asymmetry, $A_{\rm FB}$ and the angular observables $S_3$, $S_9$ and $A_9$ from the $ B ^0 \rightarrow K ^{*0} \mu ^+\mu ^- $ decay in the six bins of dimuon invariant mass squared, $ q^2$ , used in the analysis. The lower table includes the transverse observables $A_{\rm T}^{\rm Re}$ and $A_{\rm T}^{2}$, which have reduced form-factor uncertainties. Results are also presented in the $1 < q^2 < 6\mathrm{ Ge V} ^{2}/c^{4}$ range where theoretical uncertainties are best controlled. In the large-recoil bin, $0.1 < q^2 < 2.0\mathrm{ Ge V} ^{2}/c^{4}$, two results are given to highlight the size of the correction needed to account for changes in the angular distribution that occur when $ q^2 \raise.15em\hbox{$<$} \lower.35em\hbox{$\sim$} 1\mathrm{ Ge V} ^{2}/c^{4}$ (see Sec. 7.2). The value of $F_{\rm L}$ is independent of this correction. The final column contains the p-value for the SM point (see text). No SM prediction, and consequently no p-value, is available for the $10.09 < q^2 < 12.86\mathrm{ Ge V} ^{2}/c^{4}$ range. |
Table_2.pdf [56 KiB] HiDef png [224 KiB] Thumbnail [87 KiB] tex code |

|
|
Systematic contributions to the angular observables. The values given are the magnitude of the maximum contribution from each source of systematic uncertainty, taken across the six principal $ q^2$ bins used in the analysis. |
Table_3.pdf [42 KiB] HiDef png [80 KiB] Thumbnail [32 KiB] tex code |

|
![HiDef png [105 KiB]](Directory_LHCb-PAPER-2013-019/hidef_Table_1.png)
![HiDef png [224 KiB]](Directory_LHCb-PAPER-2013-019/hidef_Table_2.png)
![HiDef png [80 KiB]](Directory_LHCb-PAPER-2013-019/hidef_Table_3.png)
Supplementary Material [file]
|
README for supplementary information. A comparison of \lhcb's differential branching fraction measurement with earlier measurements from \babar~\cite{Aubert:2006vb,:2012vw}, \belle~\cite{:2009zv} and CDF~\cite{Aaltonen:2011ja} is provided in Fig.~\ref{fig:Supplementary:branching}. This figure also includes the recent CMS preliminary result~\cite{CMS-PAS-BPH-11-009}. A comparison of the angular observables is provided in Fig.~\ref{fig:Supplementary:afb}. There is good agreement between the measurements of the experiments in every \qsq bin. The parameters $S_3$ and $S_9$ have not been previously measured. Fig1-supp: Differential branching fraction of \decay{\Bz}{\Kstarz\mumu} as a function of the dimuon invariant mass squared, \qsq. The SM theory prediction is given as the continuous cyan (light) band and the rate-average of this prediction across each $q^{2}$ bin is indicated by the purple (dark) rectangular regions. No SM prediction is included for the regions close to the narrow \ccbar resonances. Previous results from \babar~\cite{:2012vw}, \belle~\cite{:2009zv} and CDF~\cite{Aaltonen:2011ja} are included for reference, as is the recent CMS preliminary result~\cite{CMS-PAS-BPH-11-009}. The bin centres of the data points have been offset for graphical purposes. Fig2-supp (a)-(d): Dimuon forward-backward asymmetry, $A_{\rm FB}$, longitudinal polarisation fraction, $F_{\rm L}$ and angular observables $A_{T}^{2}$ and $A_9$ for the decay \decay{\Bz}{\Kstarz\mumu} as a function of the dimuon invariant mass squared, \qsq. The values of these observables measured by \babar~\cite{Aubert:2006vb,:2012vw}, \belle~\cite{:2009zv}, CDF~\cite{Aaltonen:2011ja} and recent preliminary results from ATLAS~\cite{ATLAS-CONF-2013-038} and CMS~\cite{CMS-PAS-BPH-11-009} are included for reference. The SM theory prediction is given as the continuous cyan (light) band and the rate-average of this prediction across each $q^{2}$ bin is indicated by the purple (dark) rectangular regions. No SM prediction is included for the regions close to the narrow \ccbar resonances. The bin centres of the data points have been offset for graphical purposes. References: Ref CMS-PAS-BPH-11-009: CMS collaboration, Angular analysis and branching ratio measurement of the decay $B^{0} \to K^{*0} \mu^{+}\mu^{-}$, CMS-PAS-BPH-11-009 Ref ATLAS-CONF-2013-038: ATLAS collaboration, Angular analysis of $B_{d} \to K^{\ast 0}\mu^{+}\mu^{-}$ with the ATLAS experiment, ATLAS-CONF-2013-038 Ref :2009zv: Belle collaboration, J.-T. Wei et al., Measurement of the differential branching fraction and forward-backword asymmetry for $B \to K^{(*)} \ell^+\ell^-$, Phys. Rev. Lett. 103 (2009) 171801, arXiv:0904.0770 Ref Aubert:2006vb: BaBar collaboration, B.~Aubert et al., Measurements of branching fractions, rate asymmetries, and angular distributions in the rare decays $B \to K \ell^{+} \ell^{-}$ and $B \to K^{*} \ell^{+} \ell^{-}$, Phys. Rev. D. 73. 092001 arXiv:hep-ex/0604007. Ref Aaltonen:2011ja: CDF collaboration, T. Aaltonen et al., Measurements of the angular distributions in the decays $B \to K^{(*)} \mu^+ \mu^-$ at CDF, Phys. Rev. Lett. 108 081807, arXiv:1108.0695. |
Fig1-supp.pdf [20 KiB] HiDef png [201 KiB] Thumbnail [155 KiB] *C file |

|
|
Fig2a-supp.pdf [20 KiB] HiDef png [212 KiB] Thumbnail [160 KiB] *C file |
|
|
|
Fig2b-supp.pdf [20 KiB] HiDef png [202 KiB] Thumbnail [153 KiB] *C file |

|
|
|
Fig2c-supp.pdf [18 KiB] HiDef png [115 KiB] Thumbnail [97 KiB] *C file |

|
|
|
Fig2d-supp.pdf [14 KiB] HiDef png [82 KiB] Thumbnail [75 KiB] *C file |

|
![HiDef png [201 KiB]](Directory_LHCb-PAPER-2013-019/supplementary/hidef_Fig1-supp.png)
![HiDef png [212 KiB]](Directory_LHCb-PAPER-2013-019/supplementary/hidef_Fig2a-supp.png)
![HiDef png [202 KiB]](Directory_LHCb-PAPER-2013-019/supplementary/hidef_Fig2b-supp.png)
![HiDef png [115 KiB]](Directory_LHCb-PAPER-2013-019/supplementary/hidef_Fig2c-supp.png)
![HiDef png [82 KiB]](Directory_LHCb-PAPER-2013-019/supplementary/hidef_Fig2d-supp.png)
Created on 27 April 2024.