Measurement of the CKM angle $\gamma$ from a combination of $B^{\pm} \to Dh^{\pm}$ analyses
[to restricted-access page]Information
LHCb-PAPER-2013-020
CERN-PH-EP-2013-079
arXiv:1305.2050 [PDF]
(Submitted on 09 May 2013)
Phys. Lett. B726 (2013) 151
Inspire 1232503
Tools
Abstract
A combination of three LHCb measurements of the CKM angle gamma is presented. The decays B->DK and B->Dpi are used, where D denotes an admixture of D0 and D0-bar mesons, decaying into K+K-, pi+pi-, K+-pi-+, K+-pi-+pi+-pi-+, KSpi+pi-, or KSK+K- final states. All measurements use a dataset corresponding to 1.0 fb-1 of integrated luminosity. Combining results from B->DK decays alone a best-fit value of gamma = 72.0 deg is found, and confidence intervals are set gamma in [56.4,86.7] deg at 68 CL, gamma in [42.6,99.6] deg at 95 CL. The best-fit value of gamma found from a combination of results from B->Dpi decays alone, is gamma = 18.9 deg, and the confidence intervals gamma in [7.4,99.2] deg or [167.9,176.4] deg at 68 CL, are set, without constraint at 95 CL. The combination of results from B->DK and B->Dpi decays gives a best-fit value of gamma = 72.6 deg and the confidence intervals gamma in [55.4,82.3] deg at 68 CL, gamma in [40.2,92.7] deg at 95 CL are set. All values are expressed modulo 180 deg, and are obtained taking into account the effect of D0-D0bar mixing.
Figures and captions
|
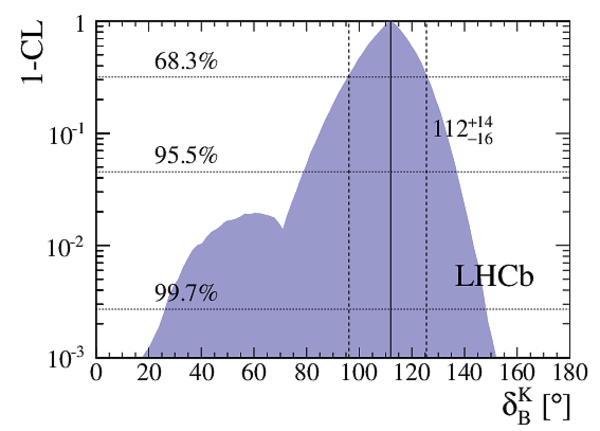
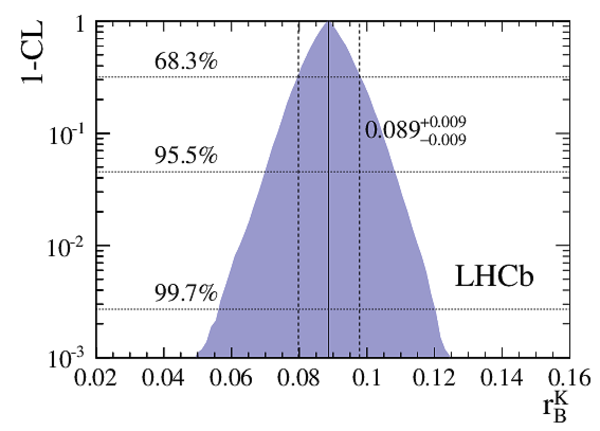
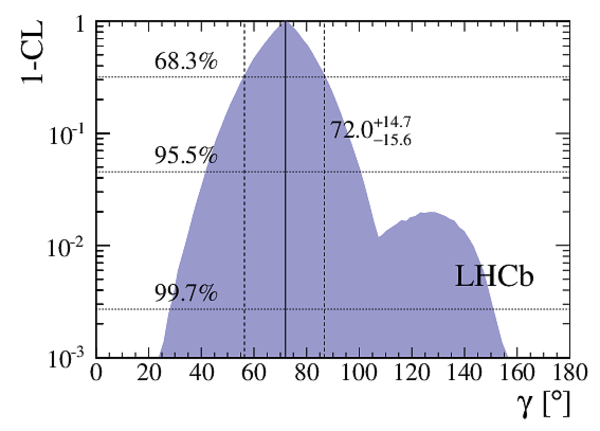
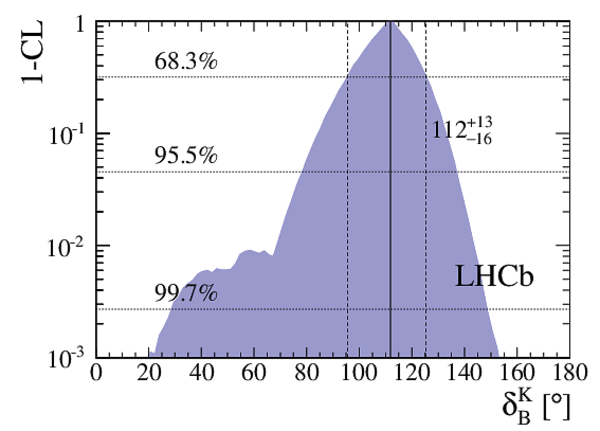
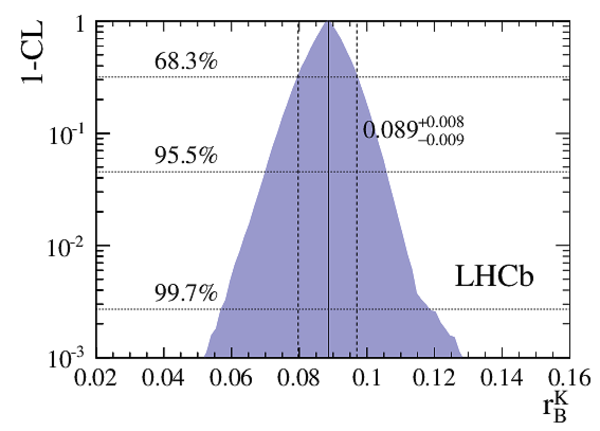
Graphs showing $ 1-{\rm CL}$ for (a) $\delta_B^K$ , (b) $ r_B^K$ , and (c) $\gamma$ , for the $ DK^\pm$ combination of the two- and four-body GLW/ADS and the $ DK^\pm$ GGSZ measurements. The reported numbers correspond to the best-fit values and the uncertainties are computed using the respective $68.3\%$ CL confidence interval shown in Table 5. |
gammac[..].pdf [14 KiB] HiDef png [239 KiB] Thumbnail [181 KiB] *.C file |
|
|
gammac[..].pdf [14 KiB] HiDef png [225 KiB] Thumbnail [177 KiB] *.C file |
|
|
|
gammac[..].pdf [14 KiB] HiDef png [242 KiB] Thumbnail [180 KiB] *.C file |
|
|
|
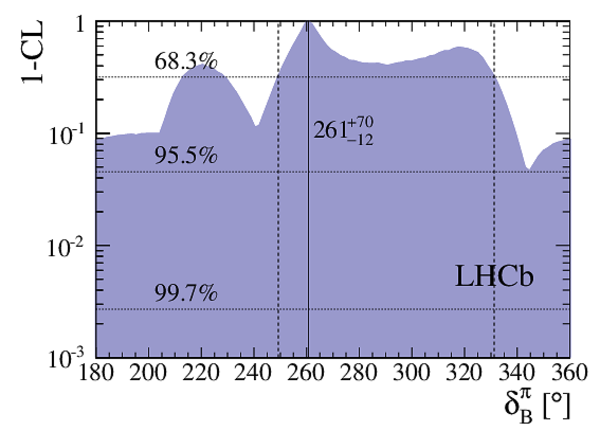
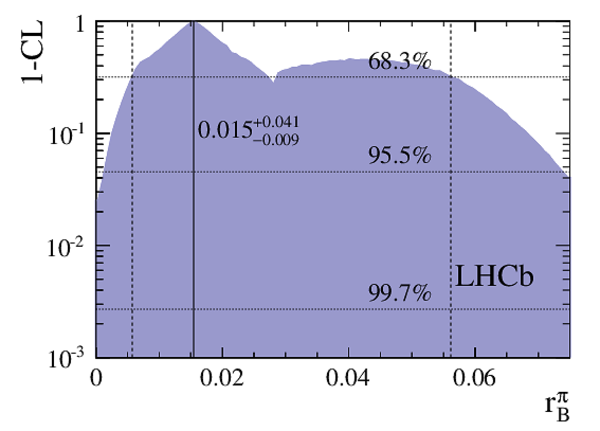
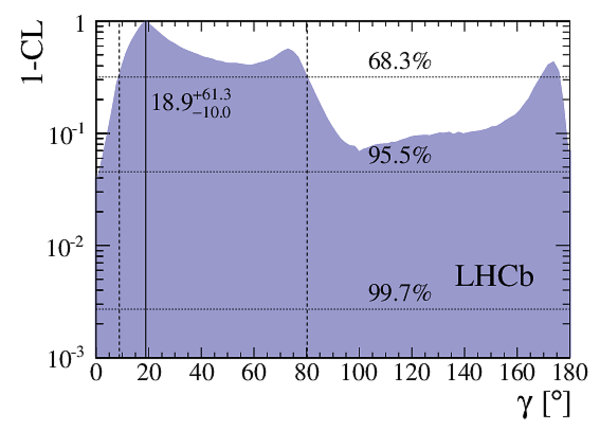
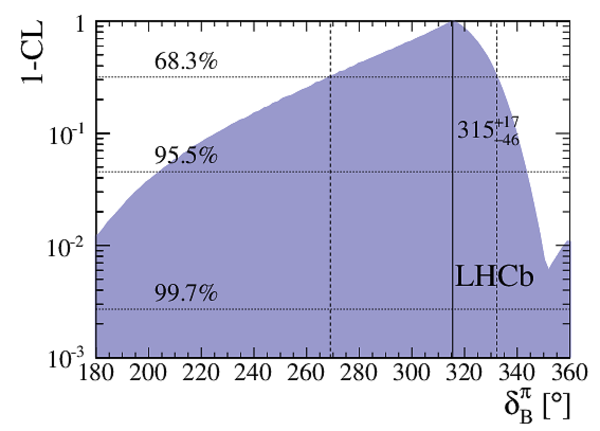
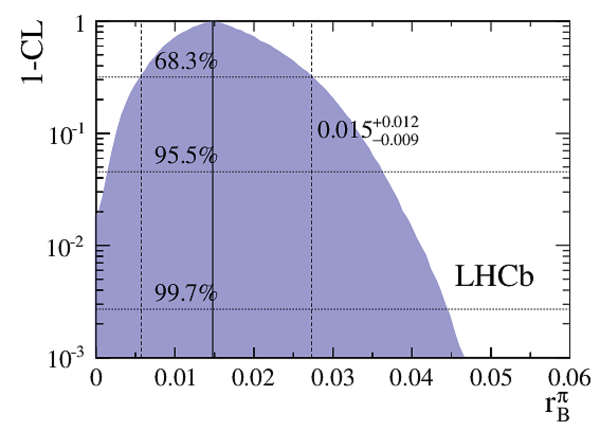
Graphs showing $ 1-{\rm CL}$ for (a) $\delta_B^{\pi}$ , (b) $ r_B^{\pi}$ , and (c) $\gamma$ , for the $ D\pi^\pm$ combination of the two- and four-body GLW/ADS measurements. The reported numbers correspond to the best-fit values and the uncertainties are computed using appropriate $68.3\%$ CL confidence intervals shown in Table 6. |
gammac[..].pdf [14 KiB] HiDef png [293 KiB] Thumbnail [204 KiB] *.C file |
|
|
gammac[..].pdf [14 KiB] HiDef png [270 KiB] Thumbnail [175 KiB] *.C file |
|
|
|
gammac[..].pdf [14 KiB] HiDef png [288 KiB] Thumbnail [196 KiB] *.C file |
|
|
|
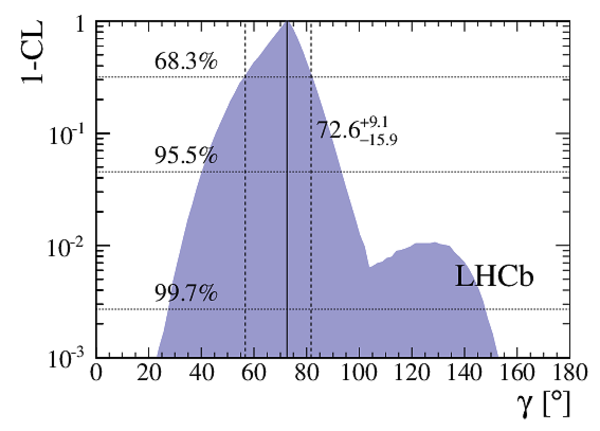
Graphs showing $ 1-{\rm CL}$ for (a) $\delta_B^K$ , (b) $\delta_B^{\pi}$ , (c) $ r_B^K$ , (d) $ r_B^{\pi}$ , and (e) $\gamma$ , for the full $ DK^\pm$ and $ D\pi^\pm$ combination. The reported numbers correspond to the best-fit values and the uncertainties are computed using appropriate $68.3\%$ CL confidence intervals shown in Table 7. |
gammac[..].pdf [14 KiB] HiDef png [237 KiB] Thumbnail [178 KiB] *.C file |
|
|
gammac[..].pdf [14 KiB] HiDef png [278 KiB] Thumbnail [198 KiB] *.C file |
|
|
|
gammac[..].pdf [14 KiB] HiDef png [224 KiB] Thumbnail [176 KiB] *.C file |
|
|
|
gammac[..].pdf [14 KiB] HiDef png [262 KiB] Thumbnail [180 KiB] *.C file |
|
|
|
gammac[..].pdf [14 KiB] HiDef png [242 KiB] Thumbnail [180 KiB] *.C file |
|
|
|
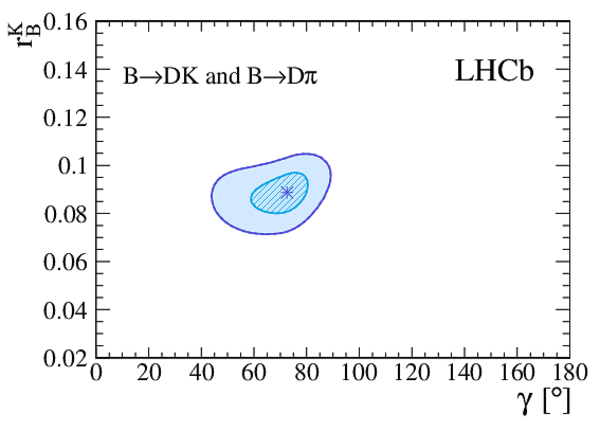
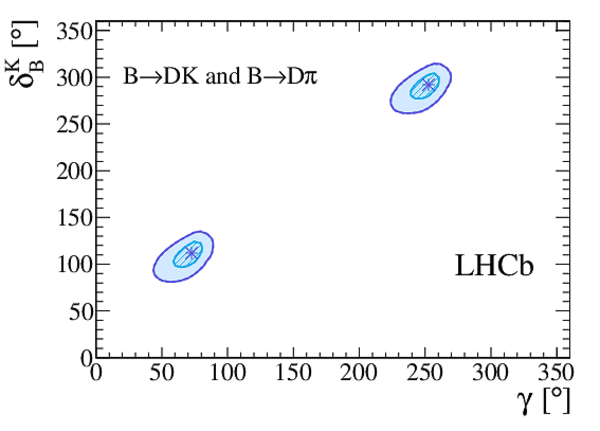
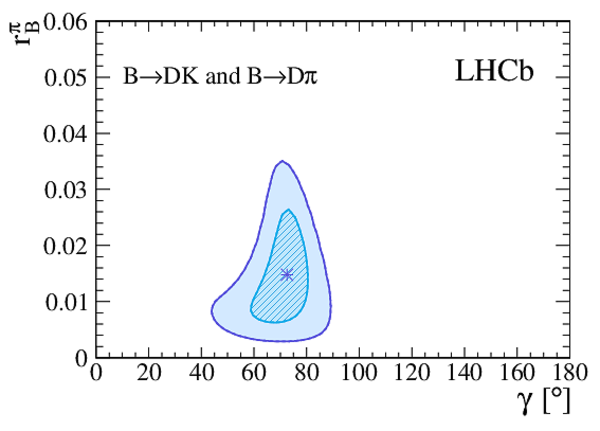
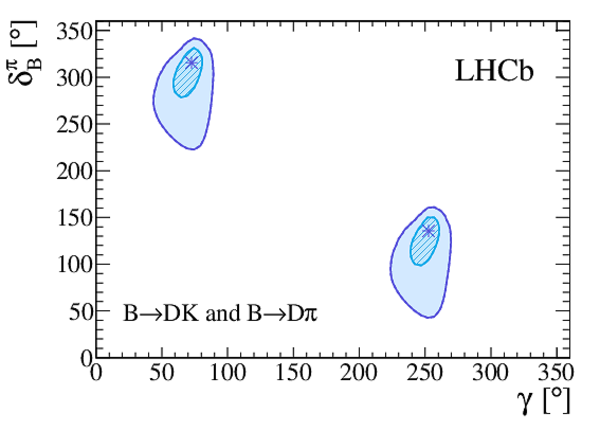
Profile likelihood contours of (a) $\gamma$ vs. $ r_B^K$ , (b) $\gamma$ vs. $\delta_B^K$ , (c) $\gamma$ vs. $ r_B^{\pi}$ , and (d) $\gamma$ vs. $\delta_B^{\pi}$ , for the full $ DK^\pm$ and $ D\pi^\pm$ combination. The contours are the $n\sigma$ profile likelihood contours, where $\Delta\chi^2=n^2$ with $n=1,2$. The markers denote the best-fit values. Subfigures (b) and (d) show the full angular range to visualize the symmetry, while subfigures (a) and (c) are expressed modulo $180^{\circ}$. |
gammac[..].pdf [14 KiB] HiDef png [172 KiB] Thumbnail [133 KiB] *.C file |
|
|
gammac[..].pdf [15 KiB] HiDef png [172 KiB] Thumbnail [133 KiB] *.C file |
|
|
|
gammac[..].pdf [15 KiB] HiDef png [223 KiB] Thumbnail [156 KiB] *.C file |
|
|
|
gammac[..].pdf [15 KiB] HiDef png [209 KiB] Thumbnail [148 KiB] *.C file |
|
|
|
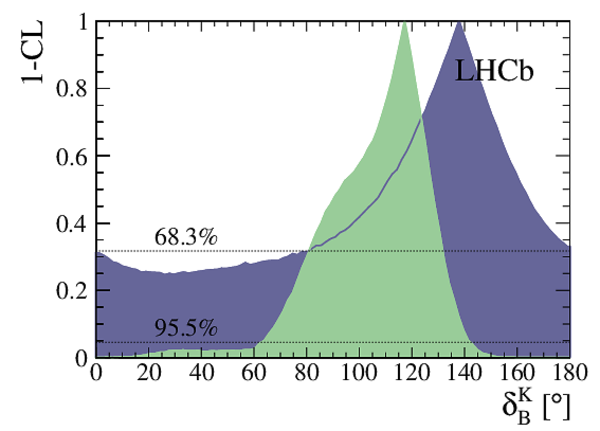
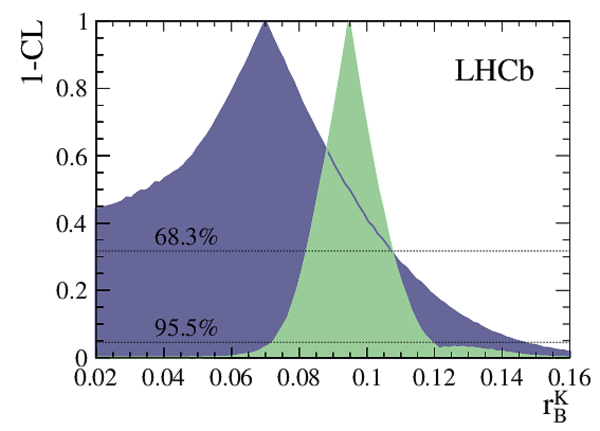
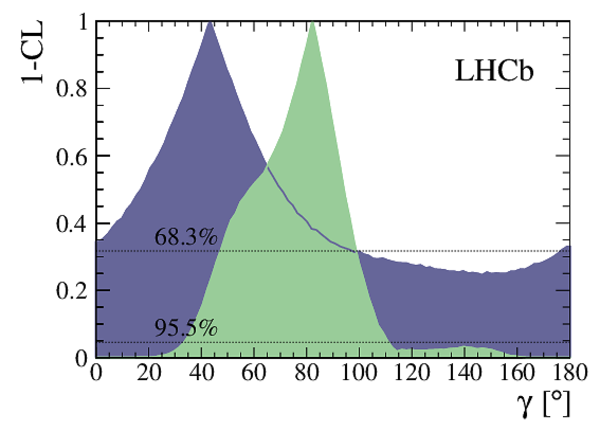
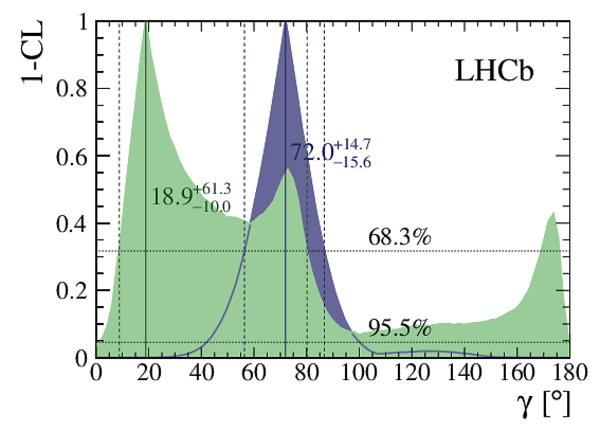
Graphs showing $ 1-{\rm CL}$ for $\delta_B^K$ , $ r_B^K$ , and $\gamma$ , separately for the GLW/ADS (light green) and GGSZ (dark purple) parts of the $ DK^\pm$ -only combination. |
gammac[..].pdf [15 KiB] HiDef png [247 KiB] Thumbnail [175 KiB] *.C file |
|
|
gammac[..].pdf [15 KiB] HiDef png [247 KiB] Thumbnail [170 KiB] *.C file |
|
|
|
gammac[..].pdf [15 KiB] HiDef png [252 KiB] Thumbnail [173 KiB] *.C file |
|
|
|
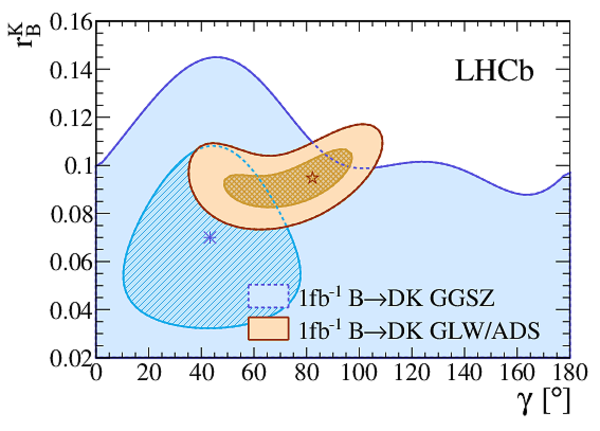
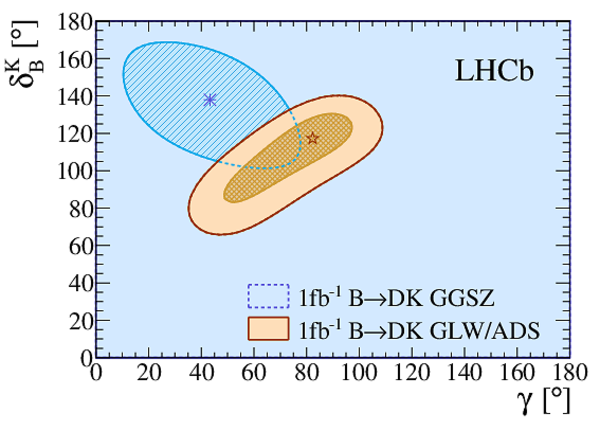
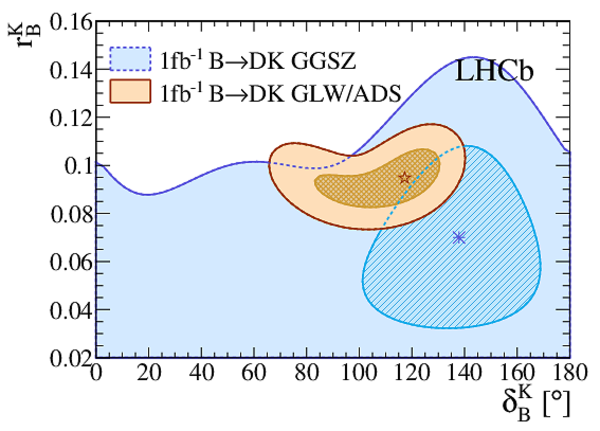
Profile likelihood contours, separately for the GGSZ (blue) and two-body and four-body GLW/ADS (orange) parts of the $ DK^\pm$ only combination. The contours are the usual $n\sigma$ profile likelihood contours, where $\Delta\chi^2=n^2$ with $n=1,2$. The markers correspond to the best-fit points. |
gammac[..].pdf [19 KiB] HiDef png [640 KiB] Thumbnail [364 KiB] *.C file |
|
|
gammac[..].pdf [18 KiB] HiDef png [621 KiB] Thumbnail [351 KiB] *.C file |
|
|
|
gammac[..].pdf [19 KiB] HiDef png [646 KiB] Thumbnail [380 KiB] *.C file |
|
|
|
Graphs showing $ 1-{\rm CL}$ for $\gamma$ , separately for the $ DK^\pm$ -only combination (dark purple) and $ D\pi^\pm$ -only combination (light green). |
gammac[..].pdf [15 KiB] HiDef png [340 KiB] Thumbnail [221 KiB] *.C file |
|
|
Animated gif made out of all figures. |
PAPER-2013-020.gif Thumbnail |

|
![HiDef png [239 KiB]](Directory_LHCb-PAPER-2013-020/hidef_gammacombo_dkonlyDmixeqDmixmeas_d_dk_pluginOnly_log.png)
![HiDef png [225 KiB]](Directory_LHCb-PAPER-2013-020/hidef_gammacombo_dkonlyDmixeqDmixmeas_r_dk_pluginOnly_log.png)
![HiDef png [242 KiB]](Directory_LHCb-PAPER-2013-020/hidef_gammacombo_dkonlyDmixeqDmixmeas_g_pluginOnly_log.png)
![HiDef png [293 KiB]](Directory_LHCb-PAPER-2013-020/hidef_gammacombo_dpionlyDmixeqDmixmeas_d_dpi_pluginOnly_log.png)
![HiDef png [270 KiB]](Directory_LHCb-PAPER-2013-020/hidef_gammacombo_dpionlyDmixeqDmixmeas_r_dpi_pluginOnly_log.png)
![HiDef png [288 KiB]](Directory_LHCb-PAPER-2013-020/hidef_gammacombo_dpionlyDmixeqDmixmeas_g_pluginOnly_log.png)
![HiDef png [237 KiB]](Directory_LHCb-PAPER-2013-020/hidef_gammacombo_dkdpiDmixeqDmixmeas_d_dk_pluginOnly_log.png)
![HiDef png [278 KiB]](Directory_LHCb-PAPER-2013-020/hidef_gammacombo_dkdpiDmixeqDmixmeas_d_dpi_pluginOnly_log.png)
![HiDef png [224 KiB]](Directory_LHCb-PAPER-2013-020/hidef_gammacombo_dkdpiDmixeqDmixmeas_r_dk_pluginOnly_log.png)
![HiDef png [262 KiB]](Directory_LHCb-PAPER-2013-020/hidef_gammacombo_dkdpiDmixeqDmixmeas_r_dpi_pluginOnly_log.png)
![HiDef png [242 KiB]](Directory_LHCb-PAPER-2013-020/hidef_gammacombo_dkdpiDmixeqDmixmeas_g_pluginOnly_log.png)
![HiDef png [172 KiB]](Directory_LHCb-PAPER-2013-020/hidef_gammacombo_dkdpiDmixeqDmixmeas_g_r_dk.png)
![HiDef png [172 KiB]](Directory_LHCb-PAPER-2013-020/hidef_gammacombo_dkdpiDmixeqDmixmeas_g_d_dk.png)
![HiDef png [223 KiB]](Directory_LHCb-PAPER-2013-020/hidef_gammacombo_dkdpiDmixeqDmixmeas_g_r_dpi.png)
![HiDef png [209 KiB]](Directory_LHCb-PAPER-2013-020/hidef_gammacombo_dkdpiDmixeqDmixmeas_g_d_dpi.png)
![HiDef png [247 KiB]](Directory_LHCb-PAPER-2013-020/hidef_gammacombo_ggsz_dkGlwAdsDmixeqDmixmeas_d_dk_pluginOnly.png)
![HiDef png [247 KiB]](Directory_LHCb-PAPER-2013-020/hidef_gammacombo_ggsz_dkGlwAdsDmixeqDmixmeas_r_dk_pluginOnly.png)
![HiDef png [252 KiB]](Directory_LHCb-PAPER-2013-020/hidef_gammacombo_ggsz_dkGlwAdsDmixeqDmixmeas_g_pluginOnly.png)
![HiDef png [640 KiB]](Directory_LHCb-PAPER-2013-020/hidef_gammacombo_ggsz_dkGlwAdsDmixeqDmixmeas_g_r_dk.png)
![HiDef png [621 KiB]](Directory_LHCb-PAPER-2013-020/hidef_gammacombo_ggsz_dkGlwAdsDmixeqDmixmeas_g_d_dk.png)
![HiDef png [646 KiB]](Directory_LHCb-PAPER-2013-020/hidef_gammacombo_ggsz_dkGlwAdsDmixeqDmixmeas_d_dk_r_dk.png)
![HiDef png [340 KiB]](Directory_LHCb-PAPER-2013-020/hidef_gammacombo_dkonlyDmixeqDmixmeas_dpionlyDmixeqDmixmeas_g_pluginOnly.png)
Tables and captions
|
Free parameters used in the combined fit. The phase differences $\delta_{K\pi}$ and $\delta_{K3\pi}$ are defined in accordance with Refs. [13,4,5], they are shifted by $180^{\circ}$ with respect to the HFAG. Also, $\gamma$ gains a sign for the conjugated modes, $A( B ^+ \rightarrow D ^0 h^+ )/A( B ^+ \rightarrow \overline{ D }{} ^0 h^+ ) = r_B^h e^{i(\delta_B^h +\gamma )}$, with $h=K,\pi$. |
Table_1.pdf [68 KiB] HiDef png [96 KiB] Thumbnail [42 KiB] tex code |

|
|
Statistical correlations of the $ B ^\pm \rightarrow Dh^\pm$, $ D\rightarrow hh$ analysis [25]. |
Table_2.pdf [39 KiB] HiDef png [52 KiB] Thumbnail [21 KiB] tex code |

|
|
Statistical correlations of the $ B ^\pm \rightarrow Dh^\pm$, $ D\rightarrow K\pi\pi\pi$ analysis [26]. |
Table_3.pdf [39 KiB] HiDef png [52 KiB] Thumbnail [24 KiB] tex code |

|
|
Results of the CLEO measurement [13]. |
Table_4.pdf [54 KiB] HiDef png [79 KiB] Thumbnail [39 KiB] tex code |

|
|
Confidence intervals and best-fit values of the $ DK^\pm$ combination for $\gamma$ , $\delta_B^K$ , and $ r_B^K$ . |
Table_5.pdf [38 KiB] HiDef png [153 KiB] Thumbnail [66 KiB] tex code |

|
|
Confidence intervals and best-fit values for the $ D\pi^\pm$ combination for $\gamma$ , $\delta_B^{\pi}$ , and $ r_B^{\pi}$ . The corrections to the $\gamma$ intervals for undercoverage and neglected systematic correlations, as described in Sect. 5, are not yet applied. |
Table_6.pdf [45 KiB] HiDef png [123 KiB] Thumbnail [54 KiB] tex code |

|
|
Confidence intervals and best-fit values for the $ DK^\pm$ and $ D\pi^\pm$ combination for $\gamma$ , $ r_B^K$ , $\delta_B^K$ , $ r_B^{\pi}$ , and $\delta_B^{\pi}$ . The corrections to the $\gamma$ intervals for undercoverage and neglected systematic correlations, as described in Sect. 5, are not yet applied. |
Table_7.pdf [39 KiB] HiDef png [159 KiB] Thumbnail [72 KiB] tex code |

|
|
Numbers of observables $n_{\rm obs}$, numbers of free parameters in the fit $n_{\rm fit}$, the minimum $\chi^2$ at the best-fit point, and fit probabilities of the best-fit point for the three combinations. The quoted uncertainties are due to the limited number of pseudoexperiments. |
Table_8.pdf [47 KiB] HiDef png [30 KiB] Thumbnail [13 KiB] tex code |

|
|
Coverage fraction $f_{\rm in} = N_{\rm in}/N$ for $\gamma$ at its best measured value for 1-, 2-, and $3\sigma$ intervals, for the plug-in method and the simpler approach based on the profile likelihood. The quoted uncertainties are due to the limited number of pseudoexperiments. |
Table_9.pdf [39 KiB] HiDef png [108 KiB] Thumbnail [48 KiB] tex code |

|
![HiDef png [96 KiB]](Directory_LHCb-PAPER-2013-020/hidef_Table_1.png)
![HiDef png [52 KiB]](Directory_LHCb-PAPER-2013-020/hidef_Table_2.png)
![HiDef png [52 KiB]](Directory_LHCb-PAPER-2013-020/hidef_Table_3.png)
![HiDef png [79 KiB]](Directory_LHCb-PAPER-2013-020/hidef_Table_4.png)
![HiDef png [153 KiB]](Directory_LHCb-PAPER-2013-020/hidef_Table_5.png)
![HiDef png [123 KiB]](Directory_LHCb-PAPER-2013-020/hidef_Table_6.png)
![HiDef png [159 KiB]](Directory_LHCb-PAPER-2013-020/hidef_Table_7.png)
![HiDef png [30 KiB]](Directory_LHCb-PAPER-2013-020/hidef_Table_8.png)
![HiDef png [108 KiB]](Directory_LHCb-PAPER-2013-020/hidef_Table_9.png)
Created on 02 May 2024.