Measurement of the relative rate of prompt $\chi_{c0}$, $\chi_{c1}$ and $\chi_{c2}$ production at $\sqrt{s}=7$TeV
[to restricted-access page]Information
LHCb-PAPER-2013-028
CERN-PH-EP-2013-114
arXiv:1307.4285 [PDF]
(Submitted on 16 Jul 2013)
JHEP 10 (2013) 115
Inspire 1242869
Tools
Abstract
Prompt production of charmonium $\chi_{c0}$, $\chi_{c1}$ and $\chi_{c2}$ mesons is studied using proton-proton collisions at the LHC at a centre-of-mass energy of $\sqrt{s}=7$TeV. The $\chi_{c}$ mesons are identified through their decay to $J/\psi\gamma$, with $J/\psi\to\mu^+\mu^-$ using photons that converted in the detector. A data sample, corresponding to an integrated luminosity of $1.0\mathrm{fb}^{-1}$ collected by the LHCb detector, is used to measure the relative prompt production rate of $\chi_{c1}$ and $\chi_{c2}$ in the rapidity range $2.0<y<4.5$ as a function of the $J/\psi$ transverse momentum from 3 to 20 GeV$/c$. First evidence for $\chi_{c0}$ meson production at a high-energy hadron collider is also presented.
Figures and captions
|
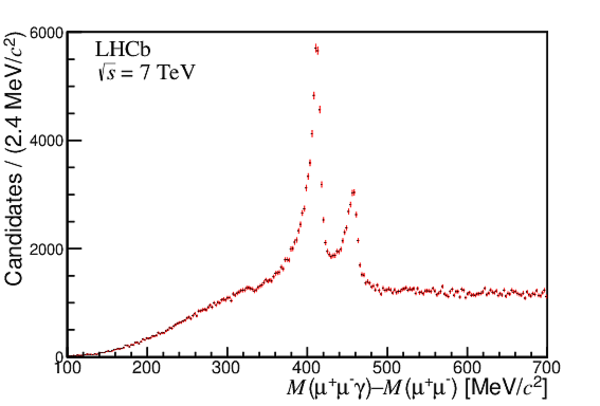
Distribution of the mass difference $\Delta M\equiv M(\mu ^+\mu ^- \gamma )-M(\mu ^+\mu ^- )$ for $\chi _{c}$ candidates with $3< p_{\rm T}^{ { J \mskip -3mu/\mskip -2mu\psi \mskip 2mu} } <20 {\mathrm{ Ge V /}c} $. |
dMall2011.pdf [22 KiB] HiDef png [157 KiB] Thumbnail [115 KiB] *.C file |
|
|
(a) Efficiency of converted photon reconstruction and selection relative to the calorimetric photon efficiency for data (red circles) and simulated events (blue triangles) as a function of $p_{\rm T}^{\gamma }$ . (b) Ratio of photon efficiencies $\varepsilon^{\gamma }_{\chi _{ c 1} }/\varepsilon^{\gamma }_{\chi _{ c 2} }$ as a function of $p_{\rm T}^{ { J \mskip -3mu/\mskip -2mu\psi \mskip 2mu} }$ from simulation (blue triangles) and after correcting the simulation for the converted photon efficiency measured in data (red circles) taken from plot (a). |
effic_[..].pdf [15 KiB] HiDef png [112 KiB] Thumbnail [95 KiB] *.C file |

|
|
ratio_[..].pdf [14 KiB] HiDef png [104 KiB] Thumbnail [87 KiB] *.C file |

|
|
|
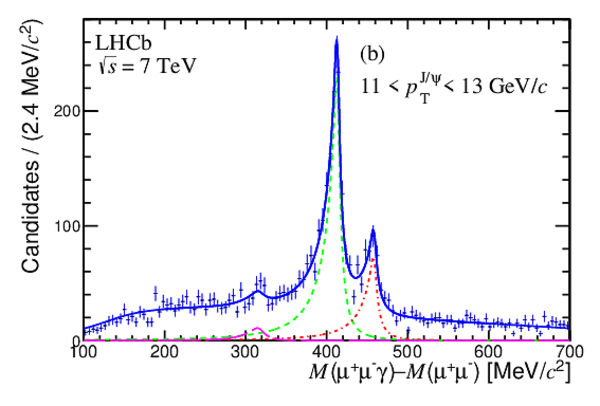
Distribution of $\Delta M=M(\mu ^+\mu ^- \gamma )-M(\mu ^+\mu ^- )$ for $p_{\rm T}^{ { J \mskip -3mu/\mskip -2mu\psi \mskip 2mu} }$ in the range (a) 4--5 $ {\mathrm{ Ge V /}c}$ and (b) 11--13 $ {\mathrm{ Ge V /}c}$ . The results of the fit are also shown, with the total fitted function (blue solid curve), the $\chi _{ c 1}$ signal (green dashed curve), the $\chi _{ c 2}$ signal (red dot-dashed curve) and the $\chi _{ c 0}$ signal (purple long-dashed curve). |
Chic20[..].pdf [37 KiB] HiDef png [240 KiB] Thumbnail [169 KiB] *.C file |

|
|
Chic20[..].pdf [34 KiB] HiDef png [239 KiB] Thumbnail [175 KiB] *.C file |
|
|
|
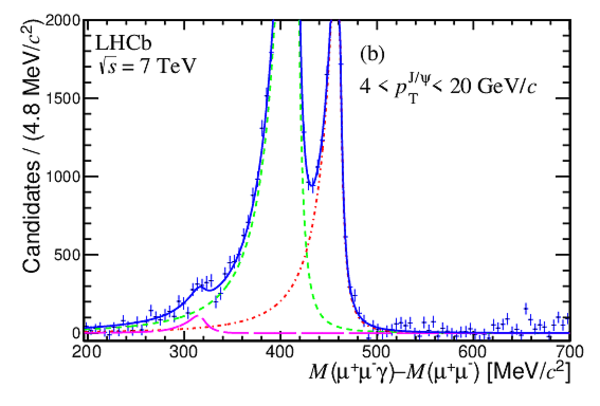
Distribution of $\Delta M=M(\mu ^+\mu ^- \gamma )-M(\mu ^+\mu ^- )$ (blue histogram) for $4< p_{\rm T}^{ { J \mskip -3mu/\mskip -2mu\psi \mskip 2mu} } <20 {\mathrm{ Ge V /}c} $. (a) The background estimated using fake photons (green) is superimposed on the $\Delta M$ distribution, together with the function used to parametrize it (black solid line). (b) The same $\Delta M$ distribution after background subtraction (using the shape shown in (a) and its fitted normalization): total fitted function (blue solid curve), $\chi _{ c 1}$ signal (green dashed curve), $\chi _{ c 2}$ signal (red dot-dashed curve) and $\chi _{ c 0}$ signal (purple long-dashed curve). |
Chic20[..].pdf [29 KiB] HiDef png [272 KiB] Thumbnail [196 KiB] *.C file |

|
|
Chic0F[..].pdf [30 KiB] HiDef png [245 KiB] Thumbnail [187 KiB] *.C file |
|
|
|
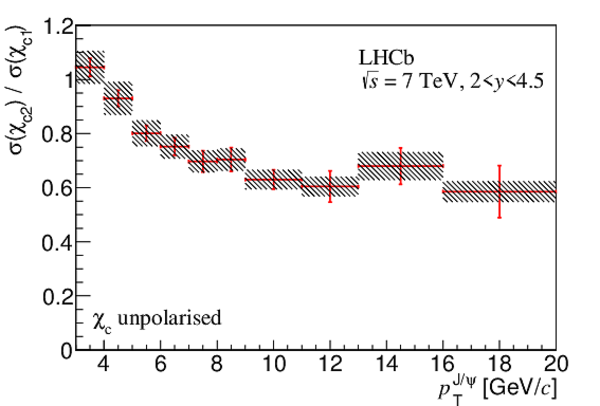
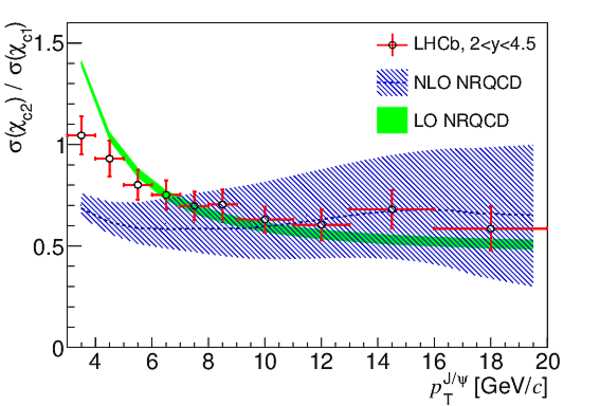
(left) Ratio of $\chi _{ c 2}$ to $\chi _{ c 1}$ cross-sections at $\sqrt{s}=7$ $\mathrm{ Te V}$ for $2.0<y<4.5$. The statistical uncertainty is shown with a red error bar and the systematic uncertainty with a hashed rectangle. (right) Comparison of the LHCb results (with total uncertainty) with the NLO NRQCD calculation from Ref. [5] (blue shading) and the LO NRQCD calculation of Ref. [24] (solid green). The LHCb results are obtained assuming the $\chi _{c}$ mesons are produced unpolarized. |
Chic_s[..].pdf [15 KiB] HiDef png [218 KiB] Thumbnail [177 KiB] *.C file |
|
|
chicra[..].pdf [17 KiB] HiDef png [672 KiB] Thumbnail [338 KiB] *.C file |
|
|
|
Comparison of the ratio of $\chi _{ c 2}$ to $\chi _{ c 1}$ cross-sections obtained by LHCb using calorimetric photons [12] (green open squares), CMS result [11] (blue filled squares), CDF result (purple filled triangles) [10] and the result presented here (red open circles) under the assumption (left) of unpolarized states and (right) under the assumption $(m_{\chi _{ c 1} },m_{\chi _{ c 2} })=(0,0)$ in the helicity frame. The uncertainty due to the limited knowledge of the branching fractions of $\chi _{c} \rightarrow { J \mskip -3mu/\mskip -2mu\psi \mskip 2mu} \gamma$, which is common to all the measurements, is not included here. |
Chicra[..].pdf [16 KiB] HiDef png [166 KiB] Thumbnail [136 KiB] *.C file |

|
|
Chicra[..].pdf [16 KiB] HiDef png [158 KiB] Thumbnail [126 KiB] *.C file |

|
|
|
Animated gif made out of all figures. |
PAPER-2013-028.gif Thumbnail |

|
![HiDef png [157 KiB]](Directory_LHCb-PAPER-2013-028/hidef_dMall2011.png)
![HiDef png [112 KiB]](Directory_LHCb-PAPER-2013-028/hidef_effic_gee-gg_DvsMC.png)
![HiDef png [104 KiB]](Directory_LHCb-PAPER-2013-028/hidef_ratio_effic_gee_chic_MCvsData.png)
![HiDef png [240 KiB]](Directory_LHCb-PAPER-2013-028/hidef_Chic2011_Fit4-5GeV.png)
![HiDef png [239 KiB]](Directory_LHCb-PAPER-2013-028/hidef_Chic2011_Fit11-13GeV.png)
![HiDef png [272 KiB]](Directory_LHCb-PAPER-2013-028/hidef_Chic2011_4-20GeV_wbkgfake.png)
![HiDef png [245 KiB]](Directory_LHCb-PAPER-2013-028/hidef_Chic0Fit_dM316MeV.png)
![HiDef png [218 KiB]](Directory_LHCb-PAPER-2013-028/hidef_Chic_sigmaratio2011.png)
![HiDef png [672 KiB]](Directory_LHCb-PAPER-2013-028/hidef_chicratio_compth.png)
![HiDef png [166 KiB]](Directory_LHCb-PAPER-2013-028/hidef_Chicratio_comp.png)
![HiDef png [158 KiB]](Directory_LHCb-PAPER-2013-028/hidef_Chicratio_comp_pol00.png)
Tables and captions
|
Systematic uncertainties on the ratio of $\chi _{ c 2}$ and $\chi _{ c 1}$ yields for each $p_{\rm T}^{ { J \mskip -3mu/\mskip -2mu\psi \mskip 2mu} }$ bin (in percent). The total systematic uncertainty is defined as the quadratic sum of all the systematic uncertainties. |
Table_1.pdf [47 KiB] HiDef png [63 KiB] Thumbnail [24 KiB] tex code |

|
|
Correction factors to be applied to the final $\sigma(\chi _{ c 2} )/\sigma(\chi _{ c 1} )$ results for each $p_{\rm T}^{ { J \mskip -3mu/\mskip -2mu\psi \mskip 2mu} }$ bin for different combinations of $\chi _{ c 1}$ and $\chi _{ c 2}$ polarization states $|J,m_{\chi_{cJ}}>$ with $|m_{\chi_{cJ}}|=0,...,J$ ("unpol" means the $\chi _{c}$ is unpolarized). The polarization axis is defined as the direction of the $\chi _{c}$ in the laboratory frame. |
Table_2.pdf [58 KiB] HiDef png [113 KiB] Thumbnail [33 KiB] tex code |

|
|
Measurements of the ratio of $\chi _{ c 2}$ to $\chi _{ c 1}$ production cross-sections for the given $p_{\rm T}^{ { J \mskip -3mu/\mskip -2mu\psi \mskip 2mu} }$ range assuming unpolarized $\chi _{c}$ production. The first uncertainty is statistical, the second is systematic, the third is from the branching fractions used and the last gives the maximum correction due to the unknown polarization. |
Table_3.pdf [53 KiB] HiDef png [143 KiB] Thumbnail [67 KiB] tex code |

|
![HiDef png [63 KiB]](Directory_LHCb-PAPER-2013-028/hidef_Table_1.png)
![HiDef png [113 KiB]](Directory_LHCb-PAPER-2013-028/hidef_Table_2.png)
![HiDef png [143 KiB]](Directory_LHCb-PAPER-2013-028/hidef_Table_3.png)
Created on 26 April 2024.