Searches for $B^0_{(s)} \to J/\psi p\bar{p}$ and $B^+ \to J/\psi p\bar{p}\pi^+$ decays
[to restricted-access page]Information
LHCb-PAPER-2013-029
CERN-PH-EP-2013-099
arXiv:1306.4489 [PDF]
(Submitted on 19 Jun 2013)
JHEP 09 (2013) 6
Inspire 1239158
Tools
Abstract
The results of searches for $B^{0}_{(s)} \rightarrow J/{\psi} p \overline{p}$ and $B^{+} \to J/{\psi} p \overline{p} {\pi}^{+}$ decays are reported. The analysis is based on a data sample, corresponding to an integrated luminosity of 1.0 fb$^{-1}$ of $pp$ collisions, collected with the LHCb detector. An excess with 2.8$ \sigma$ significance is seen for the decay $B^{0}_{s} \to J/{\psi} p \overline{p}$ and an upper limit on the branching fraction is set at the 90 confidence level: ${\cal B}(B^{0}_{s} \to J/{\psi} p \overline{p}) < 4.8 \times 10^{-6}$, which is the first such limit. No significant signals are seen for $B^{0} \to J/{\psi} p \overline{p}$ and $B^{+} \to J/{\psi} p \overline{p} {\pi}^{+}$ decays, for which the corresponding limits are set: ${\cal{B}}(B^{0} \to J/{\psi} p \overline{p}) < 5.2 \times 10^{-7}$, which significantly improves the existing limit; and ${\cal{B}}(B^{+} \to J/{\psi} p \overline{p} {\pi}^{+}) < 5.0 \times 10^{-7}$, which is the first limit on this branching fraction.
Figures and captions
|
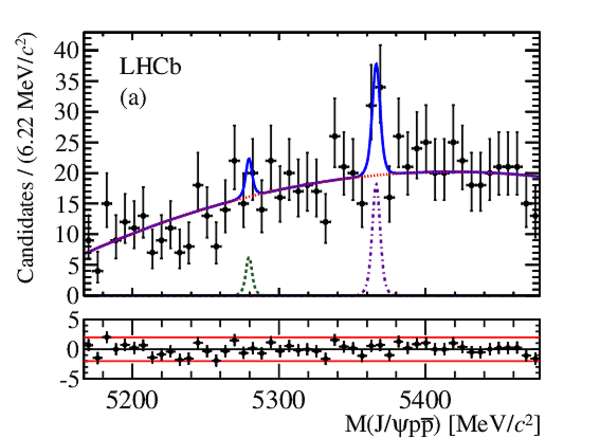
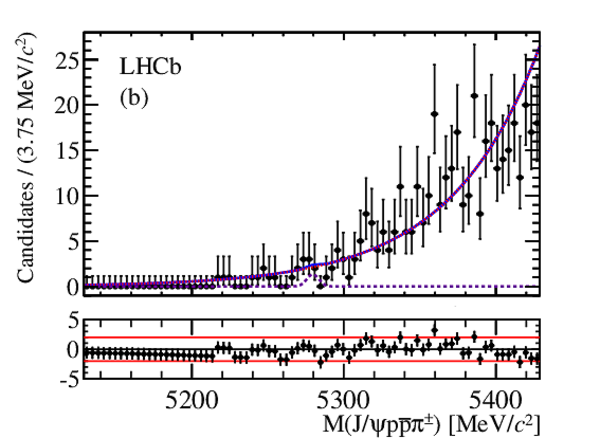
Invariant mass distribution of (a) $ B ^0_{( s )} \rightarrow { J \mskip -3mu/\mskip -2mu\psi \mskip 2mu} p \overline p $ and (b) $ B ^+ \rightarrow { J \mskip -3mu/\mskip -2mu\psi \mskip 2mu} p \overline p \pi ^+ $ candidates after the full selection. Each component of the fit model is displayed on the plot: the signal PDFs are represented by the dot-dashed violet and dashed green line; the combinatorial background by the dotted red line; and the overall fit is given by the solid blue line. The fit pulls are also shown, with the red lines corresponding to $2 \sigma$. The $ B ^+ \rightarrow { J \mskip -3mu/\mskip -2mu\psi \mskip 2mu} p \overline p \pi ^+ $ yield is multiplied by five in order to make the signal position visible. |
Fig1a.pdf [26 KiB] HiDef png [278 KiB] Thumbnail [239 KiB] *.C file |
|
|
Fig1b.pdf [28 KiB] HiDef png [263 KiB] Thumbnail [227 KiB] *.C file |
|
|
|
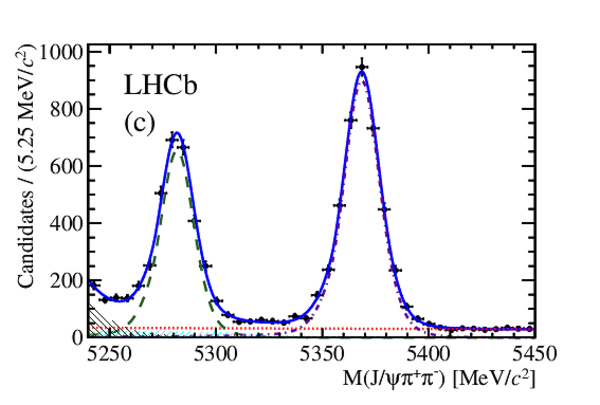
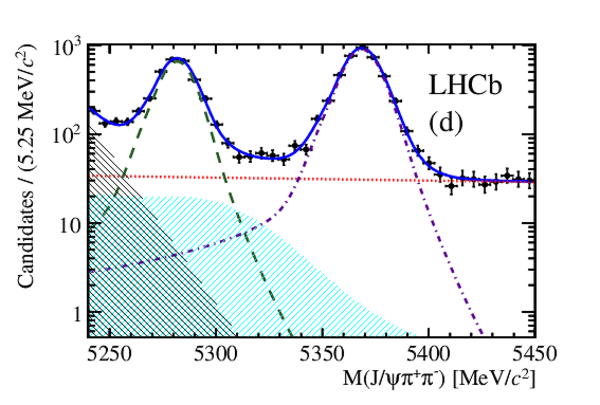
Invariant mass distribution of $ B ^0_{( s )} \rightarrow { J \mskip -3mu/\mskip -2mu\psi \mskip 2mu} \pi ^+ \pi ^- $ candidates after the full selection for the (a) $ B ^0_{( s )} \rightarrow { J \mskip -3mu/\mskip -2mu\psi \mskip 2mu} p \overline p $ and (c) $ B ^+ \rightarrow { J \mskip -3mu/\mskip -2mu\psi \mskip 2mu} p \overline p \pi ^+ $ searches. The corresponding logarithmic plots are shown in (b) and (d). Each component of the fit is represented on the plot: $ B ^0 \rightarrow { J \mskip -3mu/\mskip -2mu\psi \mskip 2mu} \pi ^+ \pi ^- $ signal (green dashed), $ B ^0_ s \rightarrow { J \mskip -3mu/\mskip -2mu\psi \mskip 2mu} \pi ^+ \pi ^- $ signal (violet dot-dashed), $ B ^0 \rightarrow { J \mskip -3mu/\mskip -2mu\psi \mskip 2mu} K ^+ \pi ^- $ background (black falling hashed), ${ B ^0_ s \rightarrow { J \mskip -3mu/\mskip -2mu\psi \mskip 2mu} \eta' }$ background (cyan rising hashed), and combinatorial background (red dotted). The overall fit is represented by the solid blue line. |
Fig2a.pdf [23 KiB] HiDef png [238 KiB] Thumbnail [169 KiB] *.C file |

|
|
Fig2b.pdf [21 KiB] HiDef png [382 KiB] Thumbnail [262 KiB] *.C file |

|
|
|
Fig2c.pdf [23 KiB] HiDef png [255 KiB] Thumbnail [179 KiB] *.C file |
|
|
|
Fig2d.pdf [21 KiB] HiDef png [420 KiB] Thumbnail [276 KiB] *.C file |
|
|
|
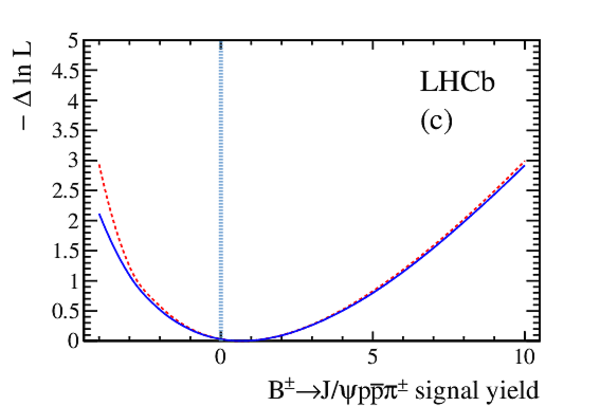
Negative log-likelihood profiles for the (a) $ B ^0 \rightarrow { J \mskip -3mu/\mskip -2mu\psi \mskip 2mu} p \overline p $ , (b) $ B ^0_ s \rightarrow { J \mskip -3mu/\mskip -2mu\psi \mskip 2mu} p \overline p $ , and (c) $ B ^+ \rightarrow { J \mskip -3mu/\mskip -2mu\psi \mskip 2mu} p \overline p \pi ^+ $ signal yields. The red dashed line corresponds to the statistical-only profile while the blue line includes all the systematic uncertainties. |
Fig3a.pdf [14 KiB] HiDef png [140 KiB] Thumbnail [108 KiB] *.C file |

|
|
Fig3b.pdf [14 KiB] HiDef png [128 KiB] Thumbnail [105 KiB] *.C file |

|
|
|
Fig3c.pdf [14 KiB] HiDef png [141 KiB] Thumbnail [124 KiB] *.C file |
|
|
|
Animated gif made out of all figures. |
PAPER-2013-029.gif Thumbnail |

|
![HiDef png [278 KiB]](Directory_LHCb-PAPER-2013-029/hidef_Fig1a.png)
![HiDef png [263 KiB]](Directory_LHCb-PAPER-2013-029/hidef_Fig1b.png)
![HiDef png [238 KiB]](Directory_LHCb-PAPER-2013-029/hidef_Fig2a.png)
![HiDef png [382 KiB]](Directory_LHCb-PAPER-2013-029/hidef_Fig2b.png)
![HiDef png [255 KiB]](Directory_LHCb-PAPER-2013-029/hidef_Fig2c.png)
![HiDef png [420 KiB]](Directory_LHCb-PAPER-2013-029/hidef_Fig2d.png)
![HiDef png [140 KiB]](Directory_LHCb-PAPER-2013-029/hidef_Fig3a.png)
![HiDef png [128 KiB]](Directory_LHCb-PAPER-2013-029/hidef_Fig3b.png)
![HiDef png [141 KiB]](Directory_LHCb-PAPER-2013-029/hidef_Fig3c.png)
Tables and captions
|
Systematic uncertainties on the branching fraction ratios of the decays $ B ^0 \rightarrow { J \mskip -3mu/\mskip -2mu\psi \mskip 2mu} p \overline p $ , $ B ^0_ s \rightarrow { J \mskip -3mu/\mskip -2mu\psi \mskip 2mu} p \overline p $ and $ B ^+ \rightarrow { J \mskip -3mu/\mskip -2mu\psi \mskip 2mu} p \overline p \pi ^+ $ measured relative to $ B ^0_ s \rightarrow { J \mskip -3mu/\mskip -2mu\psi \mskip 2mu} \pi ^+ \pi ^- $ . The total is obtained from the sum in quadrature of all contributions. |
Table_1.pdf [48 KiB] HiDef png [61 KiB] Thumbnail [26 KiB] tex code |

|
![HiDef png [61 KiB]](Directory_LHCb-PAPER-2013-029/hidef_Table_1.png)
Created on 27 April 2024.