Information
LHCb-PAPER-2013-032
CERN-PH-EP-2013-117
arXiv:1307.2476 [PDF]
(Submitted on 09 Jul 2013)
Phys. Rev. Lett. 111 (2013) 102003
Inspire 1242008
Tools
Abstract
The ratio of the \Lambda b baryon lifetime to that of the B0 meson is measured using 1.0/fb of integrated luminosity in 7 TeV center-of-mass energy pp collisions at the LHC. The \Lambda b baryon is observed for the first time in the decay mode \Lambda b -> J/\psi pK-, while the B0 meson decay used is the well known B0 -> J/\psi pi+K- mode, where the pi+ K- mass is consistent with that of the K*0(892) meson. The ratio of lifetimes is measured to be 0.976 +/- 0.012 +/- 0.006, in agreement with theoretical expectations based on the heavy quark expansion. Using previous determinations of the B0 meson lifetime, the \Lambda b lifetime is found to be 1.482 +/- 0.018 +/- 0.012 ps. In both cases the first uncertainty is statistical and the second systematic.
Figures and captions
|
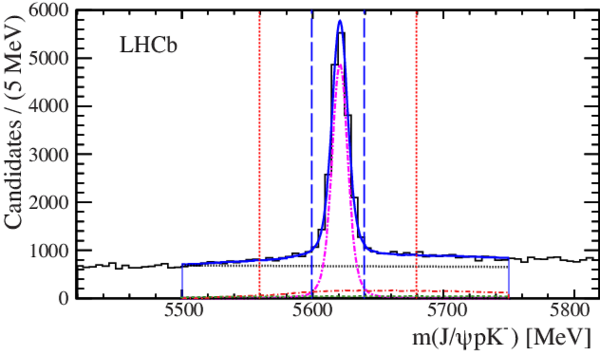
Invariant mass spectrum of $ { J \mskip -3mu/\mskip -2mu\psi \mskip 2mu} pK^-$ combinations. The signal region is between the vertical long dashed (blue) lines. The sideband regions extend from the dotted (red) lines to the edges of the plot. The fit to the data between 5500 and 5750 MeV is also shown by the (blue) solid curve, with the $\Lambda ^0_ b $ signal shown by the dashed-dot (magenta) curve. The (black) dotted line is the combinatorial background and $\overline{ B }{} ^0_ s \rightarrow { J \mskip -3mu/\mskip -2mu\psi \mskip 2mu} K ^+ K ^- $ and $\overline{ B }{} ^0 \rightarrow { J \mskip -3mu/\mskip -2mu\psi \mskip 2mu} \pi^+K^-$ reflections are shown with the (red) dashed-dot-dot and (green) dashed shapes, respectively. |
psi-pK[..].pdf [41 KiB] HiDef png [201 KiB] Thumbnail [141 KiB] *.C file |
|
|
Background subtracted $m(pK^-)$ distribution obtained by fitting the $m( { J \mskip -3mu/\mskip -2mu\psi \mskip 2mu} pK^-)$ distribution in bins of $m(pK^-)$. |
mpK_raw.pdf [34 KiB] HiDef png [230 KiB] Thumbnail [181 KiB] *.C file |

|
|
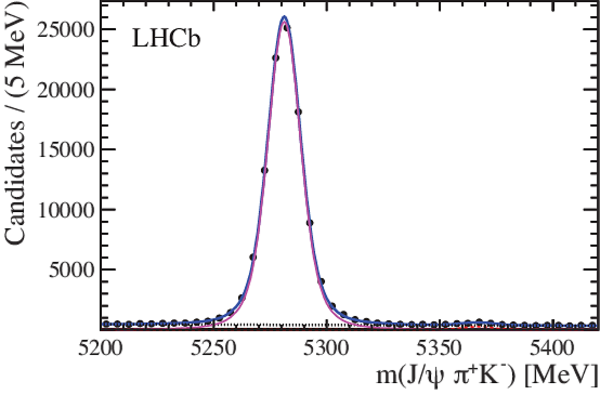
Fit to the invariant mass spectrum of $ { J \mskip -3mu/\mskip -2mu\psi \mskip 2mu} \pi^+K^-$ combinations with $\pi^+K^-$ invariant mass within $\pm$100 MeV of the $\overline{ K }{} ^{*0} $ mass. The $\overline{ B }{} ^0 $ signal is shown by the (magenta) solid curve, the combinatorial background by the (black) dotted line, the $ B ^0_ s \rightarrow { J \mskip -3mu/\mskip -2mu\psi \mskip 2mu} \pi^+K^-$ signal by the (red) dashed curve, and the total by the (blue) solid curve. |
Bd2JpsiKst.pdf [35 KiB] HiDef png [286 KiB] Thumbnail [177 KiB] *.C file |
|
|
Ratio of the decay time acceptances between $\Lambda ^0_ b \rightarrow { J \mskip -3mu/\mskip -2mu\psi \mskip 2mu} pK^-$ and $\overline{ B }{} ^0 \rightarrow { J \mskip -3mu/\mskip -2mu\psi \mskip 2mu} \overline{ K }{} ^{*0} (892)$ decays obtained from simulation. The (blue) line shows the result of the linear fit. |
Accept[..].pdf [28 KiB] HiDef png [204 KiB] Thumbnail [103 KiB] *.C file |

|
|
(a) Decay time distributions for $\Lambda ^0_ b \rightarrow { J \mskip -3mu/\mskip -2mu\psi \mskip 2mu} pK^-$ shown as (blue) circles, and $\overline{ B }{} ^0 \rightarrow { J \mskip -3mu/\mskip -2mu\psi \mskip 2mu} \overline{ K }{} ^{*0} (892)$ decays shown as (green) squares. For most entries the error bars are smaller than the points. (b) Yield ratio of $\Lambda ^0_ b \rightarrow { J \mskip -3mu/\mskip -2mu\psi \mskip 2mu} pK^-$ to $\overline{ B }{} ^0 \rightarrow { J \mskip -3mu/\mskip -2mu\psi \mskip 2mu} \overline{ K }{} ^{*0} (892)$ events fitted as a function of decay time. |
YieldA[..].pdf [39 KiB] HiDef png [139 KiB] Thumbnail [174 KiB] *.C file |

|
|
Animated gif made out of all figures. |
PAPER-2013-032.gif Thumbnail |

|
![HiDef png [201 KiB]](Directory_LHCb-PAPER-2013-032/hidef_psi-pK-mass-exp-nu.png)
![HiDef png [230 KiB]](Directory_LHCb-PAPER-2013-032/hidef_mpK_raw.png)
![HiDef png [286 KiB]](Directory_LHCb-PAPER-2013-032/hidef_Bd2JpsiKst.png)
![HiDef png [204 KiB]](Directory_LHCb-PAPER-2013-032/hidef_Acceptance_ratio.png)
![HiDef png [139 KiB]](Directory_LHCb-PAPER-2013-032/hidef_YieldANDratio.png)
Tables and captions
|
Absolute systematic uncertainties on $\Delta_{\Lambda B}$, the lifetime ratio, and the $\Lambda ^0_ b $ lifetime. |
Table_1.pdf [61 KiB] HiDef png [87 KiB] Thumbnail [41 KiB] tex code |

|
![HiDef png [87 KiB]](Directory_LHCb-PAPER-2013-032/hidef_Table_1.png)
Created on 27 April 2024.