Measurement of the flavour-specific $CP$-violating asymmetry $a_{\rm sl}^s$ in $B_s^0$ decays
[to restricted-access page]Information
LHCb-PAPER-2013-033
CERN-PH-EP-2013-141
arXiv:1308.1048 [PDF]
(Submitted on 05 Aug 2013)
Phys. Lett. B728 (2014) 607
Inspire 1246368
Tools
Abstract
The CP-violating asymmetry a_{sl}^s is studied using semileptonic decays of Bs and anti-Bs mesons produced in pp collisions at a centre-of-mass energy of 7 TeV at the LHC, exploiting a data sample corresponding to an integrated luminosity of 1.0/fb. The reconstructed final states are Ds^(+/-)\mu ^(-/+), with the Ds^(+/-) particle decaying in the \phi\pi^(+/-) mode. The Ds^(+/-)\mu ^{-/+) yields are summed over Bs and anti-Bs initial states, and integrated with respect to decay time. Data-driven methods are used to measure efficiency ratios. We obtain $a_{sl}^s$ = (-0.06 +/- 0.50 +/- 0.36), where the first uncertainty is statistical and the second systematic.
Figures and captions
|
Invariant mass distributions for: (a) $ K ^+ K ^- \pi ^+ $ and (b) $ K ^+ K ^- \pi ^- $ candidates for magnet up, (c) $ K ^+ K ^- \pi ^+ $ and (d) $ K ^+ K ^- \pi ^- $ candidates for magnet down with $ K ^+ K ^- $ invariant mass within $\pm$20 $\mathrm{ Me V} $ of the $\phi$ meson mass. The $ D ^+_ s $ [yellow (grey) shaded area] and $ D ^+$ [red (dark) shaded area] signal shapes are described in the text. The $\chi ^2$/ndf for these fits are 1.28, 1.25, 1.53, and 1.27 respectively, the corresponding p-values are 7%, 8%, 4%, 7%. |
Figure1.pdf [81 KiB] HiDef png [521 KiB] Thumbnail [284 KiB] *.C file |

|
|
Invariant $\mu ^+ \mu ^- $ mass distributions of the kinematically-selected $ { J \mskip -3mu/\mskip -2mu\psi \mskip 2mu}$ candidates in magnet up data, where the red (open) circles represent entries where the muon candidate, kinematically selected, is rejected and the black (filled) circles those where it is accepted by the muon identification algorithm. The dashed lines represent the combinatorial background. |
Figure2.pdf [51 KiB] HiDef png [352 KiB] Thumbnail [178 KiB] *.C file |

|
|
Relative muon efficiency as a function of muon momentum determined using the kinematically-selected $ { J \mskip -3mu/\mskip -2mu\psi \mskip 2mu}$ sample. |
Figure3.pdf [31 KiB] HiDef png [277 KiB] Thumbnail [144 KiB] *.C file |

|
|
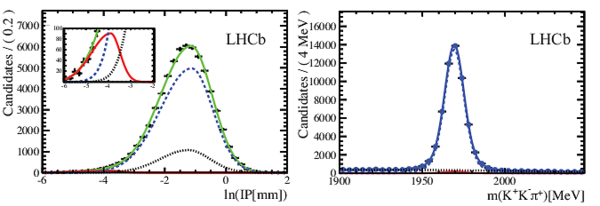
(a) Spectrum of the logarithm of the IP calculated with respect to the primary vertex for $ D ^+_ s $ candidates in combination with muons; the insert shows a magnified view of the region where the prompt $ D ^+_ s $ contribution peaks. The blue dashed line is the component coming from $B$ hadron decays, the black dashed line the false $ D ^+_ s $ background, the red line the prompt background, (b) the invariant mass distributions for $ D ^+_ s \rightarrow \phi\pi$ candidates. These distributions are for the magnet down sample. (For interpretation of the reference to colour in this figure legend, the reader is referred to the web version of this Letter.) |
fig4n1.pdf [33 KiB] HiDef png [353 KiB] Thumbnail [155 KiB] *.C file |
|
|
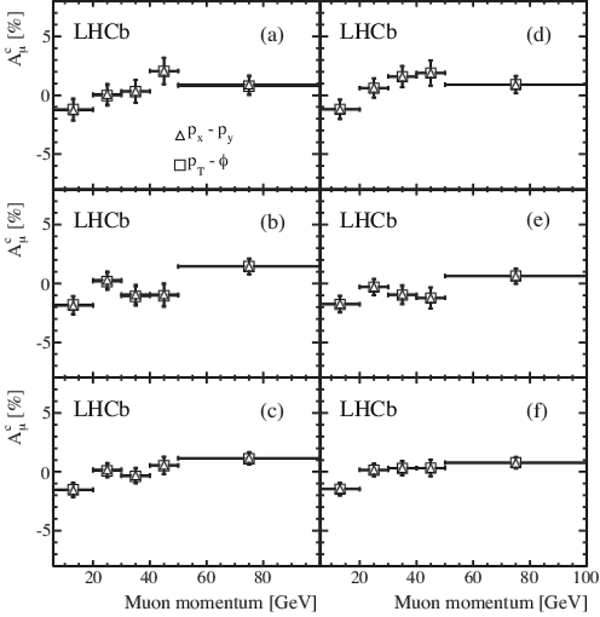
Asymmetries corrected for relative muon efficiencies, $A_{\mu}^{\text{c}}$, examined in the five muon momentum intervals for (a) magnet up data, (b) magnet down data and (c) average, using the KS muon calibration method. Then (d) magnet up data, (e) magnet down data and (f) average, using the MS muon calibration method in the two different binning scheme. |
Figure5.pdf [43 KiB] HiDef png [268 KiB] Thumbnail [282 KiB] *.C file |
|
|
Measurements of semileptonic decay asymmetries. The bands correspond to the central values $\pm$1 standard deviation uncertainties, defined as the sum in quadrature of the statistical and systematic errors. The solid dot indicates the SM prediction. |
Figure6.pdf [9 KiB] HiDef png [1 MiB] Thumbnail [527 KiB] *.C file |

|
|
Animated gif made out of all figures. |
PAPER-2013-033.gif Thumbnail |

|
![HiDef png [521 KiB]](Directory_LHCb-PAPER-2013-033/hidef_Figure1.png)
![HiDef png [352 KiB]](Directory_LHCb-PAPER-2013-033/hidef_Figure2.png)
![HiDef png [277 KiB]](Directory_LHCb-PAPER-2013-033/hidef_Figure3.png)
![HiDef png [353 KiB]](Directory_LHCb-PAPER-2013-033/hidef_fig4n1.png)
![HiDef png [268 KiB]](Directory_LHCb-PAPER-2013-033/hidef_Figure5.png)
![HiDef png [1 MiB]](Directory_LHCb-PAPER-2013-033/hidef_Figure6.png)
Tables and captions
|
Yields for $ D ^+_ s \mu ^- $ and $ D ^-_ s \mu ^+ $ events separately for magnet up and down data. These yields contain very small contributions from prompt $ D _s$ and b-hadron backgrounds. |
Table_1.pdf [49 KiB] HiDef png [51 KiB] Thumbnail [23 KiB] tex code |

|
|
Muon efficiency ratio corrected asymmetry $A_{\mu}^c$. The errors account for the statistical uncertainties in the $ B ^0_ s $ signal yields. |
Table_2.pdf [47 KiB] HiDef png [48 KiB] Thumbnail [22 KiB] tex code |

|
|
Sources of systematic uncertainty on $A_{\rm meas}$. |
Table_3.pdf [33 KiB] HiDef png [80 KiB] Thumbnail [36 KiB] tex code |

|
![HiDef png [51 KiB]](Directory_LHCb-PAPER-2013-033/hidef_Table_1.png)
![HiDef png [48 KiB]](Directory_LHCb-PAPER-2013-033/hidef_Table_2.png)
![HiDef png [80 KiB]](Directory_LHCb-PAPER-2013-033/hidef_Table_3.png)
Created on 27 April 2024.