Information
LHCb-PAPER-2013-035
CERN-PH-EP-2013-150
arXiv:1308.4583 [PDF]
(Submitted on 21 Aug 2013)
Phys. Lett. B727 (2013) 403
Inspire 1250005
Tools
Abstract
First observation of the decay Bs -> D0bar phi is reported using pp collision data, corresponding to an integrated luminosity of 1.0 fb^-1, collected by the LHCb experiment at a centre-of-mass energy of 7 TeV. The significance of the signal is 6.2 standard deviations. The branching fraction is measured relative to that of the decay Bs -> D0bar K*0bar to be 0.069 +/- 0.013 (stat) +/- 0.007 (syst). The first measurement of the ratio of branching fractions for the decays Bs -> D0bar K*0bar and Bd->D0bar K*0 is found to be 7.8 +/- 0.7 (stat) +/- 0.3 (syst) +/- 0.6 (f_s/f_d), where the last uncertainty is due to the ratio of the Bs and Bd fragmentation fractions.
Figures and captions
|
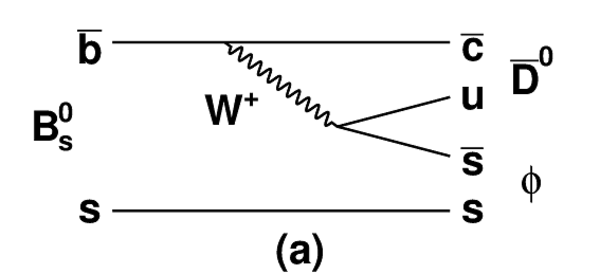
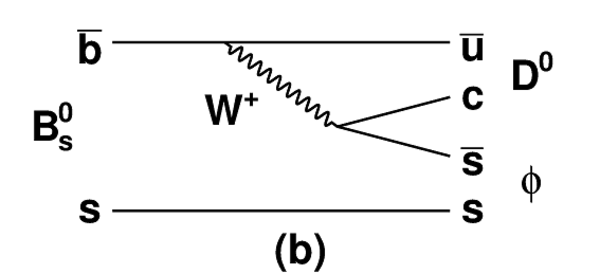
Feynman diagrams for the following decays: (a) $ B ^0_ s \rightarrow \overline{ D }{} ^0 \phi$ ; (b) $ B ^0_ s \rightarrow D ^0 \phi $; (c) $ B ^0 \rightarrow \overline{ D }{} ^0 K ^{*0} $ ; and (d) $ B ^0_ s \rightarrow \overline{ D }{} ^0 \overline{ K }{} ^{*0} $ . The $ B ^0_ s \rightarrow \overline{ D }{} ^0 \phi$ and $ B ^0_ s \rightarrow D ^0 \phi $ decay amplitudes interfere when $\overline{ D }{} ^0 $ and $ D ^0 $ decay to the same final state. |
figure1a.pdf [15 KiB] HiDef png [45 KiB] Thumbnail [25 KiB] *.C file |
|
|
figure1b.pdf [15 KiB] HiDef png [45 KiB] Thumbnail [24 KiB] *.C file |
|
|
|
figure1c.pdf [15 KiB] HiDef png [45 KiB] Thumbnail [25 KiB] *.C file |

|
|
|
figure1d.pdf [15 KiB] HiDef png [46 KiB] Thumbnail [26 KiB] *.C file |

|
|
|
Invariant mass distributions for (a) $ B ^0_ s \rightarrow \overline{ D }{} ^0 \phi$ , and (b) $ B ^0 \rightarrow \overline{ D }{} ^0 K ^{*0} $ or $ B ^0_ s \rightarrow \overline{ D }{} ^0 \overline{ K }{} ^{*0} $ decays. Data points are shown in black, the total fitted PDF as solid black line, and the components as detailed in the legends. |
figure2a.pdf [21 KiB] HiDef png [304 KiB] Thumbnail [261 KiB] *.C file |

|
|
figure2b.pdf [22 KiB] HiDef png [322 KiB] Thumbnail [274 KiB] *.C file |

|
|
|
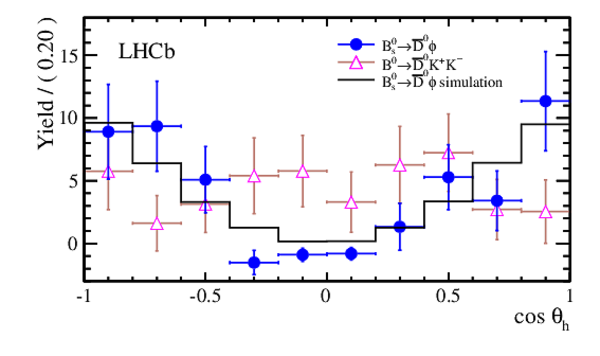
Distribution of the cosine of the helicity angle of the $\phi$ candidates. |
figure3.pdf [15 KiB] HiDef png [126 KiB] Thumbnail [105 KiB] *.C file |
|
|
Background-subtracted distributions of the reconstructed (left) $\phi$ mass from the $ B ^0_ s \rightarrow \overline{ D }{} ^0 \phi$ decay and (right) $\overline{ K }{} ^{*0} $ mass from the $ B ^0_ s \rightarrow \overline{ D }{} ^0 \overline{ K }{} ^{*0} $ decay. The dashed red line represents the S-wave component, the solid blue line the total fit result. |
figure4a.pdf [15 KiB] HiDef png [158 KiB] Thumbnail [140 KiB] *.C file |

|
|
figure4b.pdf [16 KiB] HiDef png [166 KiB] Thumbnail [143 KiB] *.C file |

|
|
|
Animated gif made out of all figures. |
PAPER-2013-035.gif Thumbnail |

|
![HiDef png [45 KiB]](Directory_LHCb-PAPER-2013-035/hidef_figure1a.png)
![HiDef png [45 KiB]](Directory_LHCb-PAPER-2013-035/hidef_figure1b.png)
![HiDef png [45 KiB]](Directory_LHCb-PAPER-2013-035/hidef_figure1c.png)
![HiDef png [46 KiB]](Directory_LHCb-PAPER-2013-035/hidef_figure1d.png)
![HiDef png [304 KiB]](Directory_LHCb-PAPER-2013-035/hidef_figure2a.png)
![HiDef png [322 KiB]](Directory_LHCb-PAPER-2013-035/hidef_figure2b.png)
![HiDef png [126 KiB]](Directory_LHCb-PAPER-2013-035/hidef_figure3.png)
![HiDef png [158 KiB]](Directory_LHCb-PAPER-2013-035/hidef_figure4a.png)
![HiDef png [166 KiB]](Directory_LHCb-PAPER-2013-035/hidef_figure4b.png)
Tables and captions
|
Uncorrected signal yields and the peaking (charmless, S-wave) background yields. |
Table_1.pdf [52 KiB] HiDef png [34 KiB] Thumbnail [15 KiB] tex code |

|
|
Absolute systematic uncertainties of the measured ratio of branching fractions. The total is obtained as sum in quadrature of the different contributions. |
Table_2.pdf [52 KiB] HiDef png [163 KiB] Thumbnail [70 KiB] tex code |

|
![HiDef png [34 KiB]](Directory_LHCb-PAPER-2013-035/hidef_Table_1.png)
![HiDef png [163 KiB]](Directory_LHCb-PAPER-2013-035/hidef_Table_2.png)
Created on 02 May 2024.