First evidence for the two-body charmless baryonic decay $B^0 \to p \bar{p}$
[to restricted-access page]Information
LHCb-PAPER-2013-038
CERN-PH-EP-2013-138
arXiv:1308.0961 [PDF]
(Submitted on 05 Aug 2013)
JHEP 10 (2013) 5
Inspire 1246367
Tools
Abstract
The results of a search for the rare two-body charmless baryonic decays $B^0 \to p \bar{p}$ and $B_s^0 \to p \bar{p}$ are reported. The analysis uses a data sample, corresponding to an integrated luminosity of 0.9 fb$^{-1}$, of $pp$ collision data collected by the LHCb experiment at a centre-of-mass energy of 7 TeV. An excess of $B^0 \to p \bar{p}$ candidates with respect to background expectations is seen with a statistical significance of 3.3 standard deviations. This is the first evidence for a two-body charmless baryonic $B^0$ decay. No significant $B_s^0 \to p \bar{p}$ signal is observed, leading to an improvement of three orders of magnitude over previous bounds. If the excess events are interpreted as signal, the 68.3 confidence level intervals on the branching fractions are {eqnarray} \cal{B}(B^0 \to p \bar{p}) & = & (1.47 ^{+0.62}_{-0.51} ^{+0.35}_{-0.14}) \times 10^{-8} , *{0.3cm} \cal{B}(B_s^0 \to p \bar{p}) & = & (2.84 ^{+2.03}_{-1.68} ^{+0.85}_{-0.18}) \times 10^{-8} , {eqnarray} where the first uncertainty is statistical and the second is systematic.
Figures and captions
|
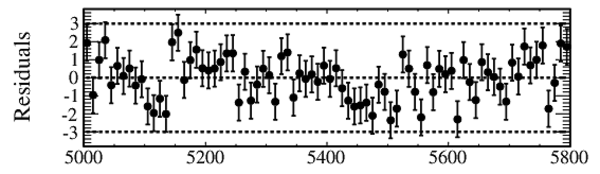
Invariant mass distribution of $ K ^+ \pi ^- $ candidates after full selection. The fit result (blue, solid) is superposed together with each fit model component as described in the legend. The normalised fit residual distribution is shown at the bottom. |
Fig1a.pdf [152 KiB] HiDef png [360 KiB] Thumbnail [253 KiB] *.C file |

|
|
Fig1b.pdf [20 KiB] HiDef png [109 KiB] Thumbnail [65 KiB] *.C file |
|
|
|
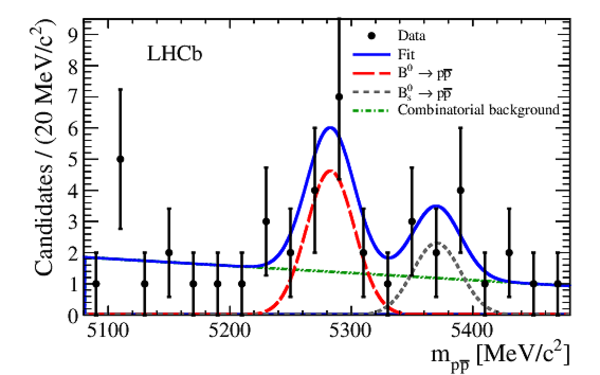
Invariant mass distribution of $ p \overline p $ candidates after full selection. The fit result (blue, solid) is superposed with each fit model component: the $ B ^0 \rightarrow p \overline p $ signal (red, dashed), the $ B ^0_ s \rightarrow p \overline p $ signal (grey, dotted) and the combinatorial background (green, dot-dashed). |
Fig2.pdf [86 KiB] HiDef png [229 KiB] Thumbnail [196 KiB] *.C file |
|
|
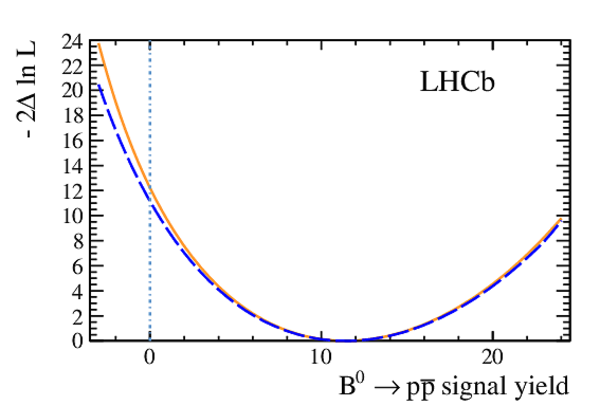
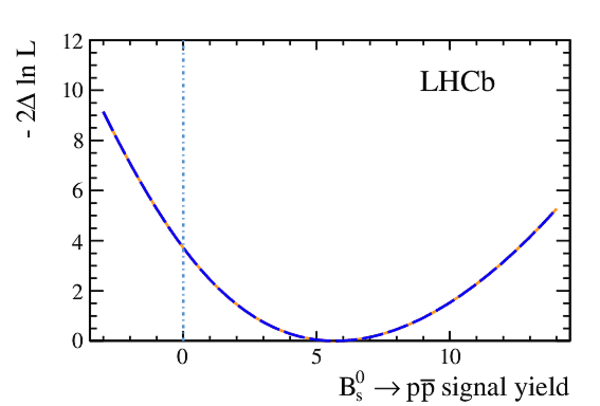
Negative logarithm of the profile likelihoods as a function of (left) the $ B ^0 \rightarrow p \overline p $ signal yield and (right) the $ B ^0_ s \rightarrow p \overline p $ signal yield. The orange solid curves correspond to the statistical-only profiles whereas the blue dashed curves include systematic uncertainties. |
Fig3a.pdf [14 KiB] HiDef png [159 KiB] Thumbnail [127 KiB] *.C file |
|
|
Fig3b.pdf [13 KiB] HiDef png [125 KiB] Thumbnail [98 KiB] *.C file |
|
|
|
Animated gif made out of all figures. |
PAPER-2013-038.gif Thumbnail |

|
![HiDef png [360 KiB]](Directory_LHCb-PAPER-2013-038/hidef_Fig1a.png)
![HiDef png [109 KiB]](Directory_LHCb-PAPER-2013-038/hidef_Fig1b.png)
![HiDef png [229 KiB]](Directory_LHCb-PAPER-2013-038/hidef_Fig2.png)
![HiDef png [159 KiB]](Directory_LHCb-PAPER-2013-038/hidef_Fig3a.png)
![HiDef png [125 KiB]](Directory_LHCb-PAPER-2013-038/hidef_Fig3b.png)
Tables and captions
|
Relative systematic uncertainties contributing to the $ B ^0 _{(s)} \rightarrow p \overline p $ branching fractions. The total corresponds to the sum of all contributions added in quadrature. |
Table_1.pdf [55 KiB] HiDef png [48 KiB] Thumbnail [21 KiB] tex code |

|
![HiDef png [48 KiB]](Directory_LHCb-PAPER-2013-038/hidef_Table_1.png)
Created on 27 April 2024.