First measurement of time-dependent $C P$ violation in $B^0_s \to K^+K^-$ decays
[to restricted-access page]Information
LHCb-PAPER-2013-040
CERN-PH-EP-2013-144
arXiv:1308.1428 [PDF]
(Submitted on 06 Aug 2013)
JHEP 10 (2013) 183
Inspire 1246901
Tools
Abstract
Direct and mixing-induced CP-violating asymmetries in Bs -> K+K- decays are measured for the first time using a data sample of pp collisions, corresponding to an integrated luminosity of 1.0 fb^{-1}, collected with the LHCb detector at a centre-of-mass energy of 7 TeV. The results are C_{KK} = 0.14 \pm 0.11 \pm 0.03 and S_{KK} = 0.30 \pm 0.12 \pm 0.04, where the first uncertainties are statistical and the second systematic. The corresponding quantities are also determined for B0 -> pi+pi- decays to be C_{pipi} = -0.38 \pm 0.15 \pm 0.02 and S_{pipi} = -0.71 \pm 0.13 \pm 0.02, in good agreement with existing measurements.
Figures and captions
|
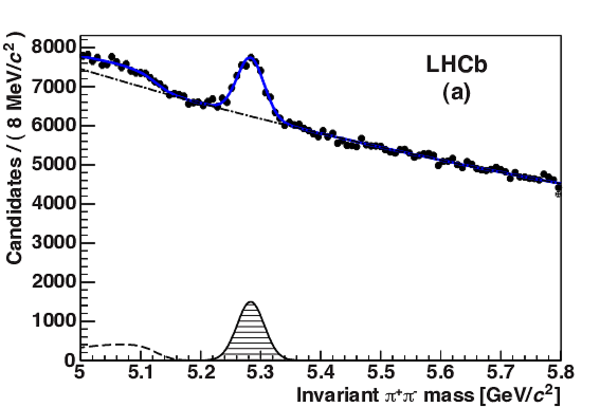
Fits to the (a) $\pi^+\pi^-$ and (b) $K^+K^-$ invariant mass spectra, after applying preselection and PID requirements. The components contributing to the fit model are shown. |
normal[..].pdf [160 KiB] HiDef png [316 KiB] Thumbnail [169 KiB] *.C file |
|
|
normal[..].pdf [174 KiB] HiDef png [337 KiB] Thumbnail [204 KiB] *.C file |

|
|
|
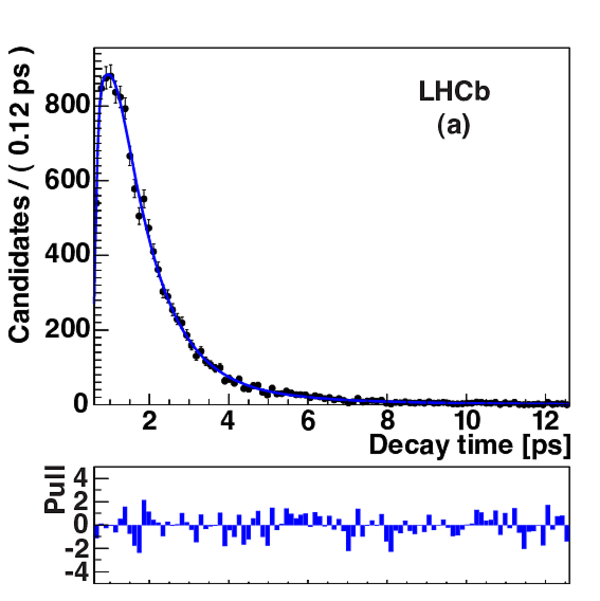
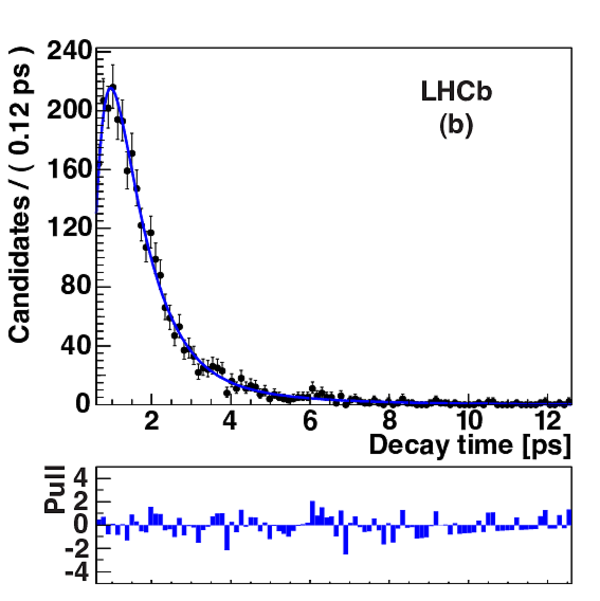
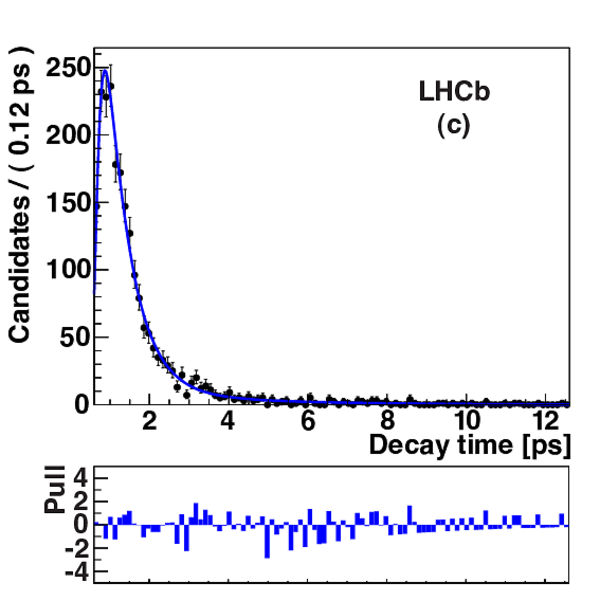
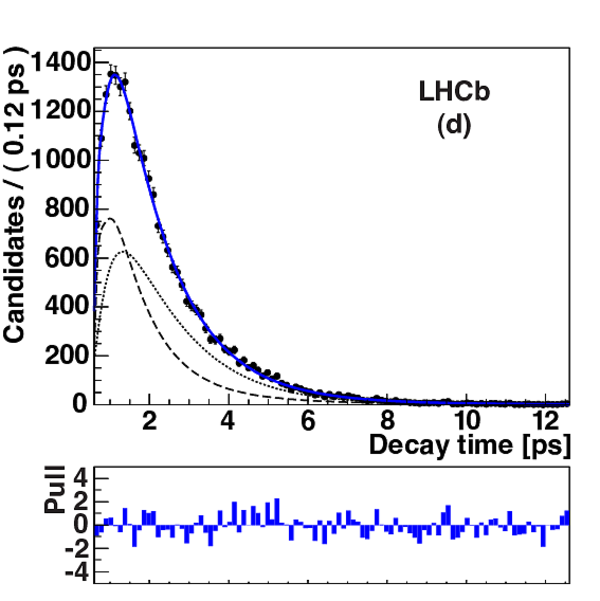
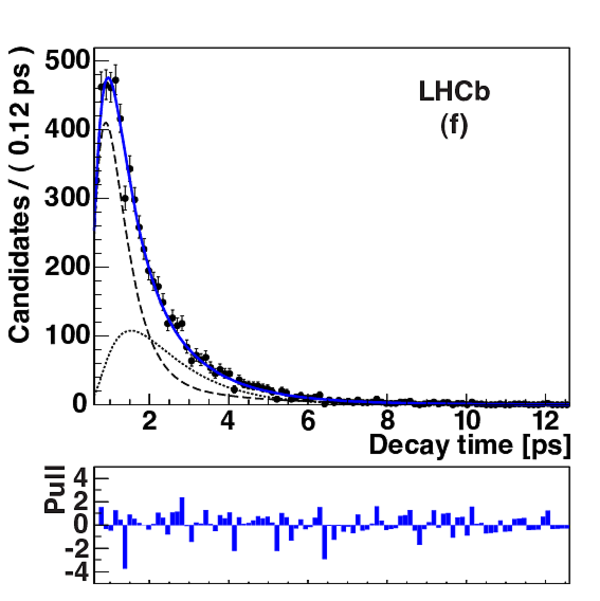
Decay time distributions corresponding to (a, b, c) high- and (d, e, f) low-mass sidebands from the (a and d) $K^\pm\pi^\mp$, (b and e) $\pi^+\pi^-$ and (c and f) $K^+K^-$ mass spectra, with the results of fits superimposed. In the bottom plots, the combinatorial background component (dashed) and the three-body background component (dotted) are shown. |
kpi_comb.pdf [127 KiB] HiDef png [214 KiB] Thumbnail [175 KiB] *.C file |
|
|
pipi_comb.pdf [128 KiB] HiDef png [224 KiB] Thumbnail [188 KiB] *.C file |
|
|
|
kk_comb.pdf [124 KiB] HiDef png [216 KiB] Thumbnail [174 KiB] *.C file |
|
|
|
kpi_phys.pdf [130 KiB] HiDef png [246 KiB] Thumbnail [210 KiB] *.C file |
|
|
|
pipi_phys.pdf [130 KiB] HiDef png [240 KiB] Thumbnail [201 KiB] *.C file |

|
|
|
kk_phys.pdf [128 KiB] HiDef png [231 KiB] Thumbnail [192 KiB] *.C file |
|
|
|
Distributions of $K^\pm\pi^\mp$ (a) mass and (b) decay time, with the result of the fit overlaid. The main components contributing to the fit model are also shown. |
mass_b[..].pdf [183 KiB] HiDef png [412 KiB] Thumbnail [236 KiB] *.C file |

|
|
KPI_time.pdf [173 KiB] HiDef png [319 KiB] Thumbnail [255 KiB] *.C file |

|
|
|
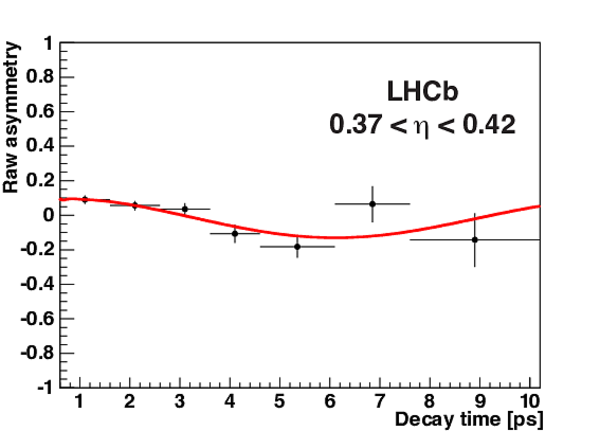
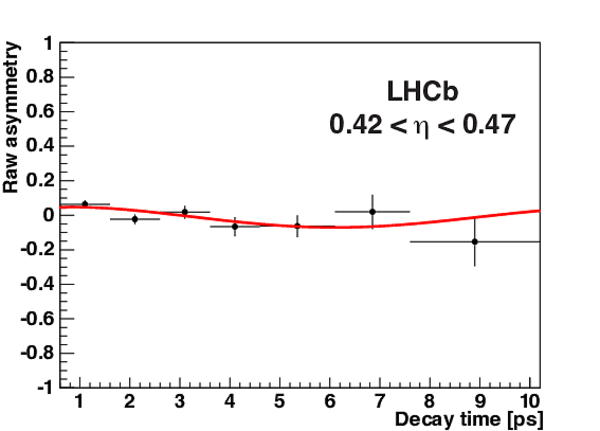
Raw mixing asymmetries for candidates in the $ B ^0 \rightarrow K ^+ \pi ^- $ signal mass region, corresponding to the five tagging categories, with the result of the fit overlaid. |
KPI_asym1.pdf [233 KiB] HiDef png [155 KiB] Thumbnail [121 KiB] *.C file |

|
|
KPI_asym2.pdf [222 KiB] HiDef png [151 KiB] Thumbnail [119 KiB] *.C file |

|
|
|
KPI_asym3.pdf [205 KiB] HiDef png [148 KiB] Thumbnail [117 KiB] *.C file |

|
|
|
KPI_asym4.pdf [193 KiB] HiDef png [142 KiB] Thumbnail [113 KiB] *.C file |
|
|
|
KPI_asym5.pdf [192 KiB] HiDef png [135 KiB] Thumbnail [111 KiB] *.C file |
|
|
|
Distributions of $K^+K^-$ (a) mass and (b) decay time, with the result of the fit overlaid. The main components contributing to the fit model are also shown. |
mass_b[..].pdf [163 KiB] HiDef png [372 KiB] Thumbnail [218 KiB] *.C file |

|
|
time_b[..].pdf [161 KiB] HiDef png [347 KiB] Thumbnail [238 KiB] *.C file |

|
|
|
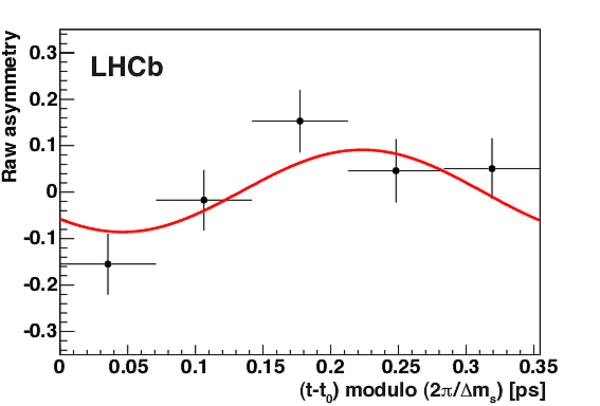
Time-dependent raw asymmetry for candidates in the $ B ^0_ s \rightarrow K ^+ K ^- $ signal mass region with the result of the fit overlaid. In order to enhance the visibility of the oscillation, only candidates belonging to the first two tagging categories are used. The offset $t_0 = 0.6$ $ {\rm ps}$ corresponds to the preselection requirement on the decay time. |
KK_2cat.pdf [150 KiB] HiDef png [146 KiB] Thumbnail [108 KiB] *.C file |
|
|
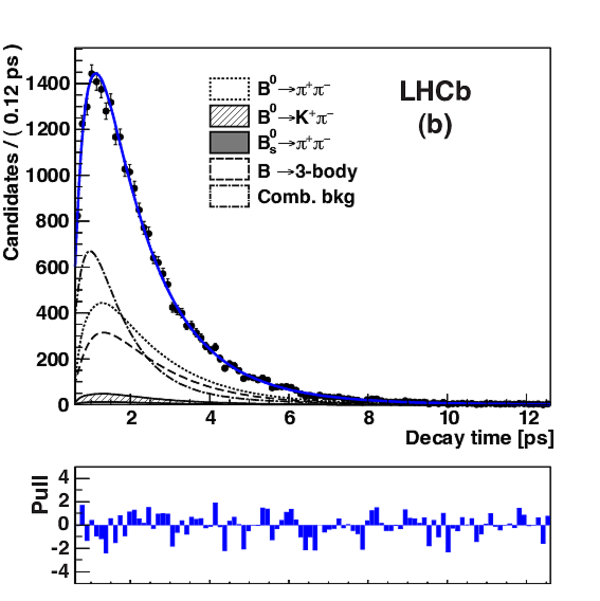
Distributions of $\pi^+\pi^-$ (a) mass and (b) decay time, with the result of the fit overlaid. The main components contributing to the fit model are also shown. |
mass_b[..].pdf [180 KiB] HiDef png [408 KiB] Thumbnail [239 KiB] *.C file |

|
|
PIPI_time.pdf [160 KiB] HiDef png [280 KiB] Thumbnail [230 KiB] *.C file |
|
|
|
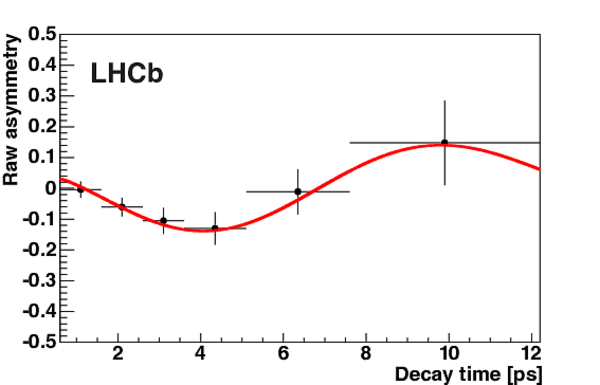
Time-dependent raw asymmetry for candidates in the $ B ^0 \rightarrow \pi ^+ \pi ^- $ signal mass region with the result of the fit overlaid. Tagged candidates belonging to all tagging categories are used. |
cA_sig[..].pdf [215 KiB] HiDef png [113 KiB] Thumbnail [100 KiB] *.C file |
|
|
Animated gif made out of all figures. |
PAPER-2013-040.gif Thumbnail |

|
![HiDef png [316 KiB]](Directory_LHCb-PAPER-2013-040/hidef_normalizationPIPI.png)
![HiDef png [337 KiB]](Directory_LHCb-PAPER-2013-040/hidef_normalizationKK.png)
![HiDef png [214 KiB]](Directory_LHCb-PAPER-2013-040/hidef_kpi_comb.png)
![HiDef png [224 KiB]](Directory_LHCb-PAPER-2013-040/hidef_pipi_comb.png)
![HiDef png [216 KiB]](Directory_LHCb-PAPER-2013-040/hidef_kk_comb.png)
![HiDef png [246 KiB]](Directory_LHCb-PAPER-2013-040/hidef_kpi_phys.png)
![HiDef png [240 KiB]](Directory_LHCb-PAPER-2013-040/hidef_pipi_phys.png)
![HiDef png [231 KiB]](Directory_LHCb-PAPER-2013-040/hidef_kk_phys.png)
![HiDef png [412 KiB]](Directory_LHCb-PAPER-2013-040/hidef_mass_bdkpi_pipisel.png)
![HiDef png [319 KiB]](Directory_LHCb-PAPER-2013-040/hidef_KPI_time.png)
![HiDef png [155 KiB]](Directory_LHCb-PAPER-2013-040/hidef_KPI_asym1.png)
![HiDef png [151 KiB]](Directory_LHCb-PAPER-2013-040/hidef_KPI_asym2.png)
![HiDef png [148 KiB]](Directory_LHCb-PAPER-2013-040/hidef_KPI_asym3.png)
![HiDef png [142 KiB]](Directory_LHCb-PAPER-2013-040/hidef_KPI_asym4.png)
![HiDef png [135 KiB]](Directory_LHCb-PAPER-2013-040/hidef_KPI_asym5.png)
![HiDef png [372 KiB]](Directory_LHCb-PAPER-2013-040/hidef_mass_bskk_kksel.png)
![HiDef png [347 KiB]](Directory_LHCb-PAPER-2013-040/hidef_time_bskk_kksel.png)
![HiDef png [146 KiB]](Directory_LHCb-PAPER-2013-040/hidef_KK_2cat.png)
![HiDef png [408 KiB]](Directory_LHCb-PAPER-2013-040/hidef_mass_bdpipi_pipisel.png)
![HiDef png [280 KiB]](Directory_LHCb-PAPER-2013-040/hidef_PIPI_time.png)
![HiDef png [113 KiB]](Directory_LHCb-PAPER-2013-040/hidef_cA_sig_OMPI_PIPI.png)
Tables and captions
|
Kinematic requirements applied by the event preselection. |
Table_1.pdf [57 KiB] HiDef png [145 KiB] Thumbnail [64 KiB] tex code |

|
|
Definition of the five tagging categories determined from the optimization algorithm, in terms of ranges of the mistag probability $\eta$. |
Table_2.pdf [28 KiB] HiDef png [103 KiB] Thumbnail [36 KiB] tex code |

|
|
Signal tagging efficiencies, mistag probabilities and associated asymmetries, corresponding to the five tagging categories, as determined from the $K^\pm\pi^\mp$ mass and decay time fit. The uncertainties are statististical only. |
Table_3.pdf [47 KiB] HiDef png [49 KiB] Thumbnail [22 KiB] tex code |

|
|
Systematic uncertainties affecting the $B^0_s \rightarrow K^+K^-$ and $B^0 \rightarrow \pi^+\pi^-$ direct and mixing-induced $ C P$ asymmetry coefficients. The total systematic uncertainties are obtained by summing the individual contributions in quadrature. |
Table_4.pdf [36 KiB] HiDef png [130 KiB] Thumbnail [56 KiB] tex code |

|
![HiDef png [145 KiB]](Directory_LHCb-PAPER-2013-040/hidef_Table_1.png)
![HiDef png [103 KiB]](Directory_LHCb-PAPER-2013-040/hidef_Table_2.png)
![HiDef png [49 KiB]](Directory_LHCb-PAPER-2013-040/hidef_Table_3.png)
![HiDef png [130 KiB]](Directory_LHCb-PAPER-2013-040/hidef_Table_4.png)
Created on 27 April 2024.