First observation of $\overline{B}^0 \rightarrow J/\psi K^{+}K^{-}$ and search for $\overline{B}^0 \rightarrow J/\psi \phi$ decays
[to restricted-access page]Information
LHCb-PAPER-2013-045
CERN-PH-EP-2013-159
arXiv:1308.5916 [PDF]
(Submitted on 27 Aug 2013)
Phys. Rev. D88 (2013) 072005
Inspire 1251062
Tools
Abstract
The first observation of the B0->J/\psi K+K- decay is presented with a data sample corresponding to an integrated luminosity of 1.0/fb of pp collisions at a center-of-mass energy of 7 TeV collected with the LHCb detector. The branching fraction is measured to be B(B0->J/\psi K+K-) = (2.53 +/- 0.31 +/- 0.19)x10^{-6}, where the first uncertainty is statistical and the second is systematic. An amplitude analysis of the final state in the B0->J/\psi K+K- decay is performed to separate resonant and nonresonant contributions in the K+K- spectrum. Evidence of the a0(980) resonance is reported with statistical significance of 3.9 standard deviations. The corresponding product branching fraction is measured to be B(B0->J/\psi a0(980), a0(980)->K+K-)=(4.70 +/- 3.31 +/- 0.72)x10^{-7}, yielding an upper limit of B(B0->J/\psi a0(980), a0(980)->K+K-)<9.0x10^{-7} at 90 confidence level. No evidence of the resonant decay B0->J/\psi\phi\; is found, and an upper limit on its branching fraction is set to be B(B0->J/\psi\phi)< 1.9x10^{-7} at 90 confidence level.
Figures and captions
|
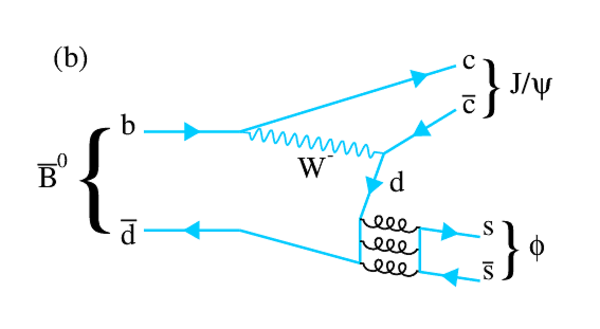
Feynman diagrams for (a) $\overline{ B }{} ^0 \rightarrow { J \mskip -3mu/\mskip -2mu\psi \mskip 2mu} K ^+ K ^- $, and (b) $\overline{ B }{} ^0 \rightarrow { J \mskip -3mu/\mskip -2mu\psi \mskip 2mu} \phi$. |
Feynman_1.pdf [13 KiB] HiDef png [100 KiB] Thumbnail [66 KiB] *.C file |

|
|
Feynman_2.pdf [15 KiB] HiDef png [116 KiB] Thumbnail [79 KiB] *.C file |
|
|
|
Distribution of the BDT classifier for both training and test samples of $ { J \mskip -3mu/\mskip -2mu\psi \mskip 2mu} K ^+ K ^- $ signal and background events. The signal samples are from simulation and the background samples are from data. The small difference between the background training and test samples is due to the fact that the sidebands used in the two cases are not identical. |
BDT_re[..].pdf [39 KiB] HiDef png [442 KiB] Thumbnail [256 KiB] *.C file |

|
|
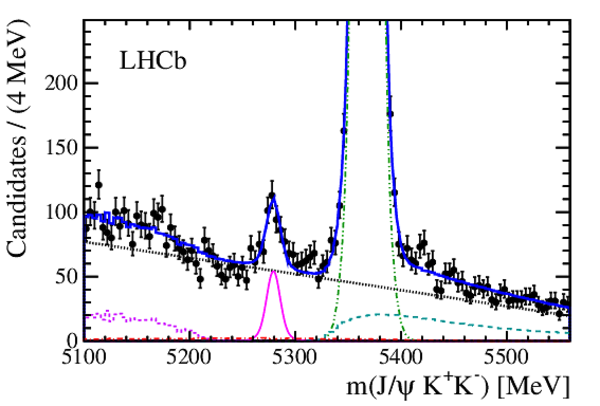
Invariant mass of $ { J \mskip -3mu/\mskip -2mu\psi \mskip 2mu} K ^+ K ^- $ combinations. The data are fitted with a sum of two Gaussian functions for each signal peak and several background components. The (magenta) solid double-Gaussian function centered at 5280 MeV is the $\overline{ B }{} ^0 $ signal, the (black) dotted curve shows the combinatorial background, the (green) dashed-dot-dot curve shows the contribution of $\overline{ B }{} ^0_ s \rightarrow { J \mskip -3mu/\mskip -2mu\psi \mskip 2mu} K ^+ K ^- $ decays, the (violet) dashed shape is the $\overline{ B }{} ^0_ s \rightarrow { J \mskip -3mu/\mskip -2mu\psi \mskip 2mu} K ^+ \pi^0 K ^- $ background, $\Lambda ^0_ b \rightarrow { J \mskip -3mu/\mskip -2mu\psi \mskip 2mu} p K ^- $ and $\overline{ B }{} ^0 \rightarrow { J \mskip -3mu/\mskip -2mu\psi \mskip 2mu} K ^- \pi ^+ $ reflections are shown by (red) dot-dashed and (cyan) long dashed shapes, respectively and the (blue) solid curve is the total. |
Bd2JpsiKK.pdf [26 KiB] HiDef png [290 KiB] Thumbnail [230 KiB] *.C file |
|
|
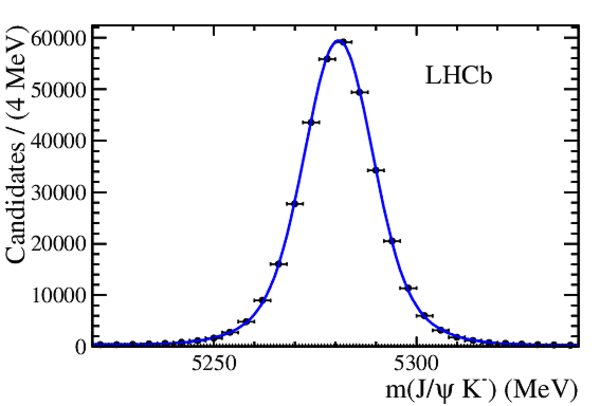
Fit to the invariant mass spectrum of $ { J \mskip -3mu/\mskip -2mu\psi \mskip 2mu} K ^- $ combinations. The (blue) solid curve is the total and the (black) dotted line shows the combinatorial background. |
Bu2JpsiK.pdf [17 KiB] HiDef png [171 KiB] Thumbnail [144 KiB] *.C file |
|
|
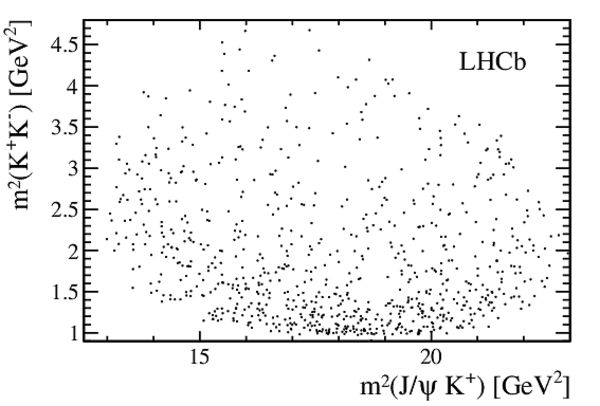
Distribution of $m^2( K ^+ K ^- )$ versus $m^2( { J \mskip -3mu/\mskip -2mu\psi \mskip 2mu} K ^+ )$ for $ { J \mskip -3mu/\mskip -2mu\psi \mskip 2mu} K ^+ K ^- $ candidates with mass within $\pm 20$ MeV of the $\overline{ B }{} ^0 $ mass. |
dalitz.pdf [53 KiB] HiDef png [127 KiB] Thumbnail [81 KiB] *.C file |
|
|
Exponential fit to the acceptance parameter $a(s_{23})$. |
acccosH.pdf [12 KiB] HiDef png [104 KiB] Thumbnail [96 KiB] *.C file |

|
|
Parametrized detection efficiency as a function of $m^2( K ^+ K ^- )$ versus $ m^2( { J \mskip -3mu/\mskip -2mu\psi \mskip 2mu} K ^+ )$. The $z$-axis scale is arbitrary. |
eff3.pdf [3 MiB] HiDef png [2 MiB] Thumbnail [579 KiB] *.C file |

|
|
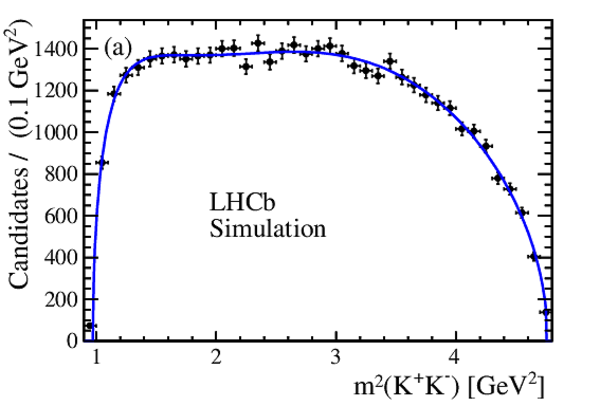
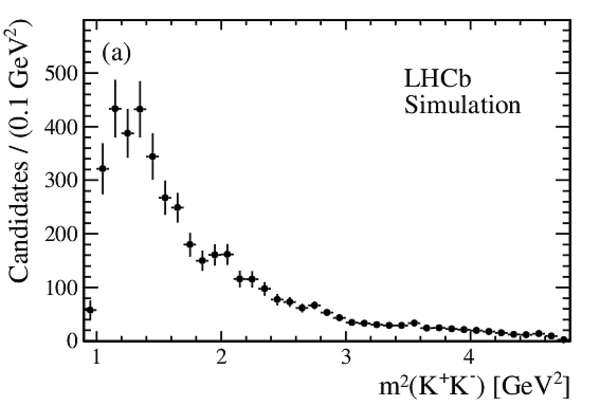
Projections of (a) $m^2( K ^+ K ^- )$ and (b) $ m^2( { J \mskip -3mu/\mskip -2mu\psi \mskip 2mu} K ^+ )$ of the simulated Dalitz plot used to measure the efficiency parameters. The points represent the simulated event distributions, and the curves the projections of the polynomial fit. |
effy.pdf [17 KiB] HiDef png [177 KiB] Thumbnail [157 KiB] *.C file |
|
|
effx.pdf [16 KiB] HiDef png [166 KiB] Thumbnail [151 KiB] *.C file |

|
|
|
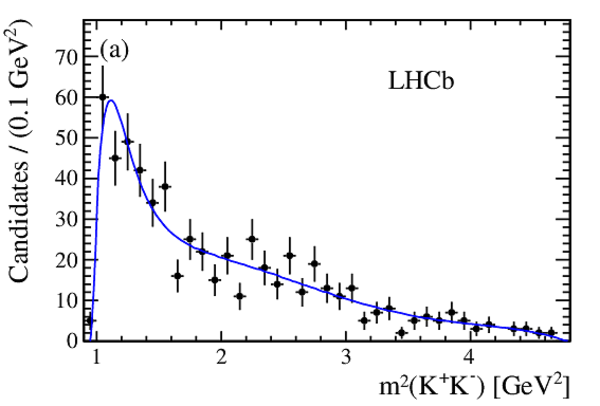
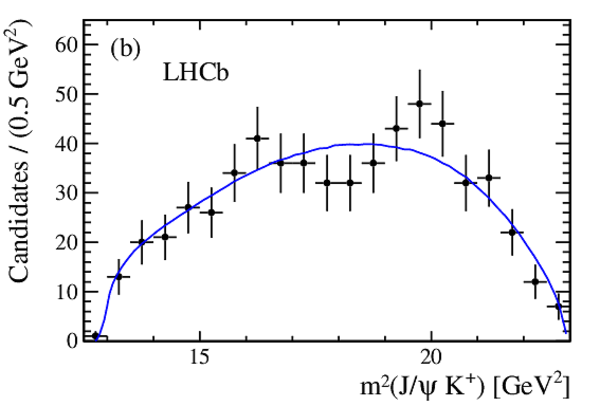
Invariant mass squared projections of (a) $K^+K^-$, and (b) $ { J \mskip -3mu/\mskip -2mu\psi \mskip 2mu} K^{+}$ from the Dalitz plot of candidates in the $\overline{ B }{} ^0$ mass sidebands, with fit projection overlaid. |
BKGy.pdf [16 KiB] HiDef png [157 KiB] Thumbnail [146 KiB] *.C file |
|
|
BKGx.pdf [16 KiB] HiDef png [140 KiB] Thumbnail [128 KiB] *.C file |
|
|
|
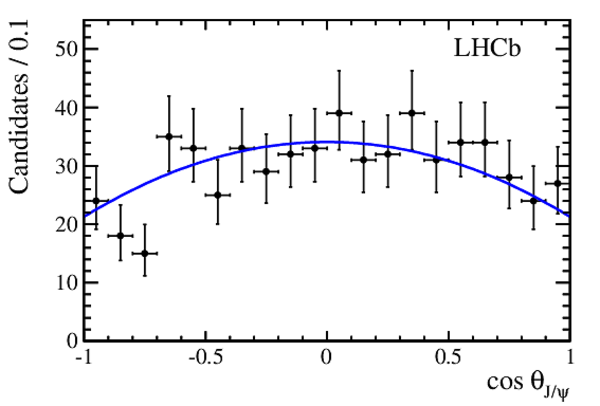
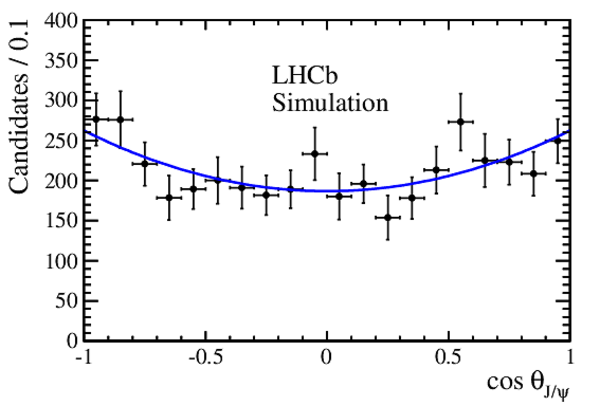
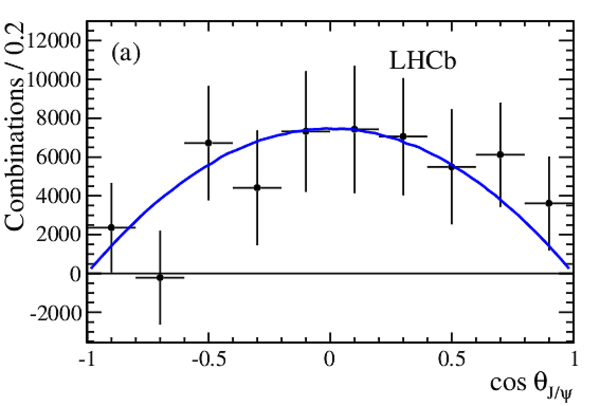
Distribution of $\cos \theta_{ { J \mskip -3mu/\mskip -2mu\psi \mskip 2mu} }$ from the $\overline{ B }{} ^0$ mass sidebands, fitted with the function $1+\alpha \cos^{2} \theta_{ { J \mskip -3mu/\mskip -2mu\psi \mskip 2mu} }$. |
BKGcosH.pdf [16 KiB] HiDef png [121 KiB] Thumbnail [112 KiB] *.C file |
|
|
Projections of the reflection background in the variables (a) $ m^2(K^+K^-)$ and (b) $ m^2( { J \mskip -3mu/\mskip -2mu\psi \mskip 2mu} K^{+})$. |
refy.pdf [15 KiB] HiDef png [94 KiB] Thumbnail [55 KiB] *.C file |
|
|
refx.pdf [15 KiB] HiDef png [101 KiB] Thumbnail [59 KiB] *.C file |

|
|
|
Distribution of $\cos \theta_{ { J \mskip -3mu/\mskip -2mu\psi \mskip 2mu} }$ for the reflection background, fitted with the function $1+\beta \cos^{2} \theta_{ { J \mskip -3mu/\mskip -2mu\psi \mskip 2mu} }$. |
refcosH.pdf [17 KiB] HiDef png [141 KiB] Thumbnail [136 KiB] *.C file |
|
|
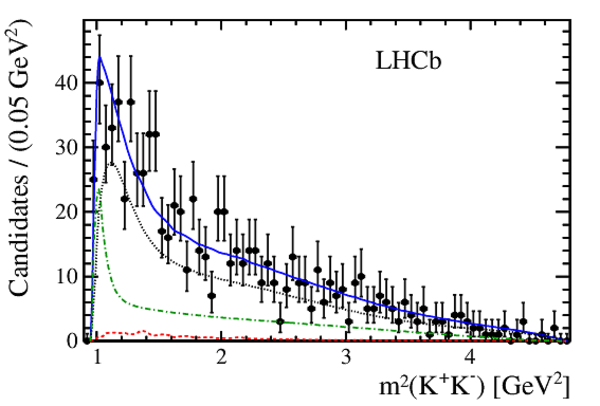
Dalitz plot fit projection of $m^2( K ^+ K ^- )$ in the signal region. The points with error bars are data, the (black) dotted curve shows the combinatorial background, the (red) dashed curve indicates the reflection from the misidentified $\Lambda ^0_ b \rightarrow { J \mskip -3mu/\mskip -2mu\psi \mskip 2mu} p K ^- $ decays, the (green) dot-dashed curve is the signal, and the (blue) solid line represents the total. |
y.pdf [22 KiB] HiDef png [235 KiB] Thumbnail [199 KiB] *.C file |
|
|
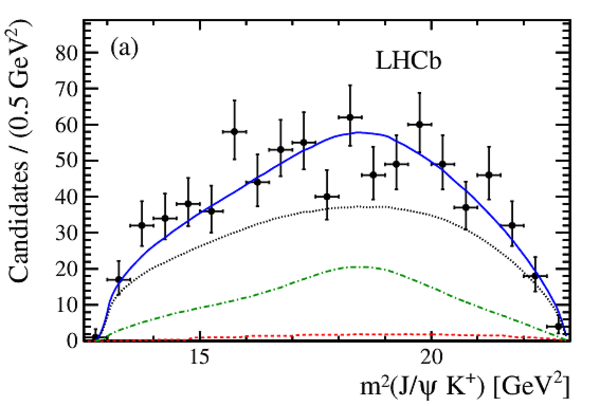
Dalitz plot fit projections of (a) $m^2( { J \mskip -3mu/\mskip -2mu\psi \mskip 2mu} K^{+})$ and (b) $\cos \theta_{ { J \mskip -3mu/\mskip -2mu\psi \mskip 2mu} }$ in the signal region. The points with error bars are data, the (black) dotted curve shows the combinatorial background, the (red) dashed curve indicates the reflection from the misidentified $\Lambda ^0_ b \rightarrow { J \mskip -3mu/\mskip -2mu\psi \mskip 2mu} p K ^- $ decays, the (green) dot-dashed curve is the signal, and the (blue) solid line represents the total. |
x.pdf [18 KiB] HiDef png [205 KiB] Thumbnail [182 KiB] *.C file |
|
|
cosH.pdf [15 KiB] HiDef png [168 KiB] Thumbnail [147 KiB] *.C file |

|
|
|
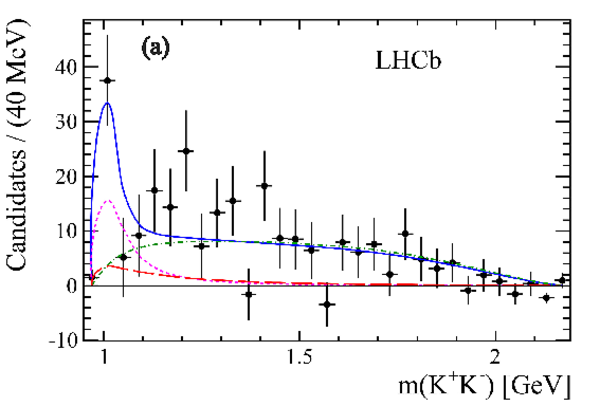
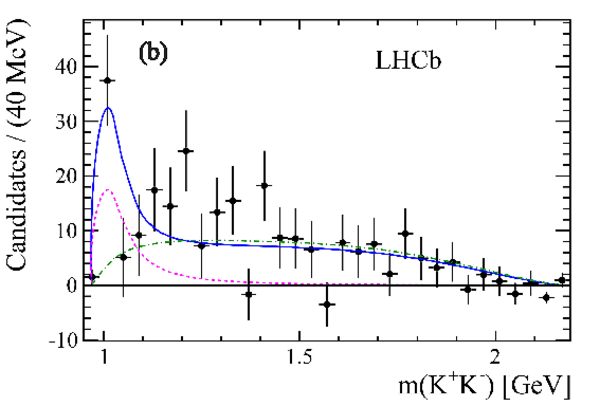
Background-subtracted $m( K ^+ K ^- )$ distributions for (a) default and, (b) alternate fit models in the signal region. The points with error bars are data, the (magenta) dashed curve shows the $a_0(980)$ resonance, the nonresonant contribution is shown by (green) dot-dashed curve and the (blue) solid curve represents the sum of $a_0(980)$, nonresonant and the interference between the two. The (red) long-dashed curve in (a) shows the $f_0(980)$ contribution. |
mkk_f0980.pdf [365 KiB] HiDef png [348 KiB] Thumbnail [138 KiB] *.C file |
|
|
mkk.pdf [361 KiB] HiDef png [351 KiB] Thumbnail [133 KiB] *.C file |
|
|
|
Background-subtracted and efficiency-corrected distribution of (a) $ \cos\theta_{ { J \mskip -3mu/\mskip -2mu\psi \mskip 2mu} }$ ($\chi^2/\rm ndf=5.3/10$) and (b) $\cos \theta_{KK}$ ($\chi^2/\rm ndf=12.8/10$). The points with error bars are data and the (blue) solid lines show the fit to the default model. |
bgsubcosH.pdf [15 KiB] HiDef png [140 KiB] Thumbnail [124 KiB] *.C file |
|
|
bgsubcosK.pdf [14 KiB] HiDef png [127 KiB] Thumbnail [121 KiB] *.C file |

|
|
|
Animated gif made out of all figures. |
PAPER-2013-045.gif Thumbnail |

|
![HiDef png [100 KiB]](Directory_LHCb-PAPER-2013-045/hidef_Feynman_1.png)
![HiDef png [116 KiB]](Directory_LHCb-PAPER-2013-045/hidef_Feynman_2.png)
![HiDef png [442 KiB]](Directory_LHCb-PAPER-2013-045/hidef_BDT_response.png)
![HiDef png [290 KiB]](Directory_LHCb-PAPER-2013-045/hidef_Bd2JpsiKK.png)
![HiDef png [171 KiB]](Directory_LHCb-PAPER-2013-045/hidef_Bu2JpsiK.png)
![HiDef png [127 KiB]](Directory_LHCb-PAPER-2013-045/hidef_dalitz.png)
![HiDef png [104 KiB]](Directory_LHCb-PAPER-2013-045/hidef_acccosH.png)
![HiDef png [2 MiB]](Directory_LHCb-PAPER-2013-045/hidef_eff3.png)
![HiDef png [177 KiB]](Directory_LHCb-PAPER-2013-045/hidef_effy.png)
![HiDef png [166 KiB]](Directory_LHCb-PAPER-2013-045/hidef_effx.png)
![HiDef png [157 KiB]](Directory_LHCb-PAPER-2013-045/hidef_BKGy.png)
![HiDef png [140 KiB]](Directory_LHCb-PAPER-2013-045/hidef_BKGx.png)
![HiDef png [121 KiB]](Directory_LHCb-PAPER-2013-045/hidef_BKGcosH.png)
![HiDef png [94 KiB]](Directory_LHCb-PAPER-2013-045/hidef_refy.png)
![HiDef png [101 KiB]](Directory_LHCb-PAPER-2013-045/hidef_refx.png)
![HiDef png [141 KiB]](Directory_LHCb-PAPER-2013-045/hidef_refcosH.png)
![HiDef png [235 KiB]](Directory_LHCb-PAPER-2013-045/hidef_y.png)
![HiDef png [205 KiB]](Directory_LHCb-PAPER-2013-045/hidef_x.png)
![HiDef png [168 KiB]](Directory_LHCb-PAPER-2013-045/hidef_cosH.png)
![HiDef png [348 KiB]](Directory_LHCb-PAPER-2013-045/hidef_mkk_f0980.png)
![HiDef png [351 KiB]](Directory_LHCb-PAPER-2013-045/hidef_mkk.png)
![HiDef png [140 KiB]](Directory_LHCb-PAPER-2013-045/hidef_bgsubcosH.png)
![HiDef png [127 KiB]](Directory_LHCb-PAPER-2013-045/hidef_bgsubcosK.png)
Tables and captions
|
Fit fractions and phases of the contributing components. The components of the form $\rm X+Y$ are the interference terms. Note that, in the default model the $f_0(980)$ amplitude strength is fixed to the expected value. Poisson likelihood $\chi^2$ [24] is used to calculate the $\chi^2$. |
Table_1.pdf [48 KiB] HiDef png [56 KiB] Thumbnail [25 KiB] tex code |

|
|
Relative systematic uncertainties on branching fractions (%). |
Table_2.pdf [49 KiB] HiDef png [97 KiB] Thumbnail [46 KiB] tex code |

|
![HiDef png [56 KiB]](Directory_LHCb-PAPER-2013-045/hidef_Table_1.png)
![HiDef png [97 KiB]](Directory_LHCb-PAPER-2013-045/hidef_Table_2.png)
Created on 27 April 2024.