Information
LHCb-PAPER-2013-050
CERN-PH-EP-2013-183
arXiv:1310.2535 [PDF]
(Submitted on 09 Oct 2013)
Phys. Lett. B728 (2014) 234
Inspire 1257744
Tools
Abstract
A search for the D0 to \pi+ \pi- \mu+ \mu- decay, where the muon pair does not originate from a resonance, is performed using proton-proton collision data corresponding to an integrated luminosity of 1.0 fb-1 recorded by the LHCb experiment at a centre-of-mass energy of 7 TeV. No signal is observed and an upper limit on the relative branching fraction with respect to the resonant decay mode D0 to \pi+ \pi- \phi(to \mu+ \mu-), under the assumption of a phase-space model, is found to be B(D0 to \pi+ \pi- mu+ mu-)/B(D0 to \pi+ \pi- \phi(to \mu+ \mu-)) < 0.96 at the 90 confidence level. The upper limit on the absolute branching fraction is evaluated to be B(D0 to \pi+ \pi- \mu+ \mu-) < 5.5 x 10⁻⁷ at 90 confidence level. This is the most stringent to date.
Figures and captions
|
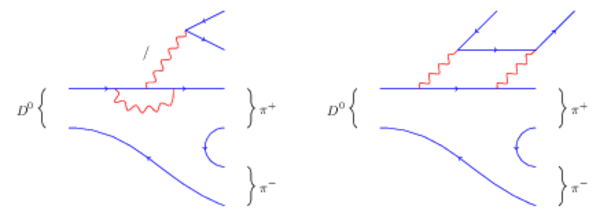
Leading Feynman diagrams for the FCNC decay $ D ^0 \rightarrow \pi ^+ \pi ^- \mu ^+\mu ^- $ in the SM. |
Fig_1.pdf [26 KiB] HiDef png [47 KiB] Thumbnail [30 KiB] *.C file tex code |
|
|
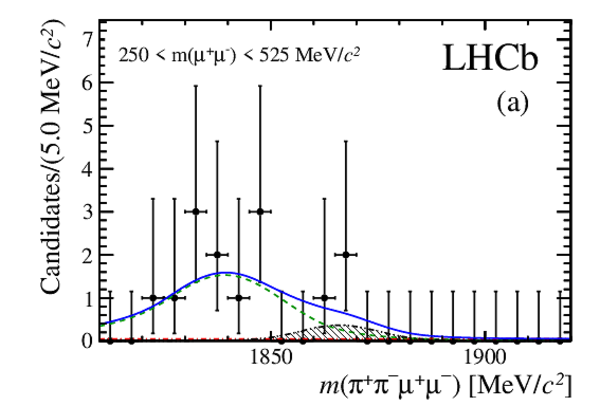
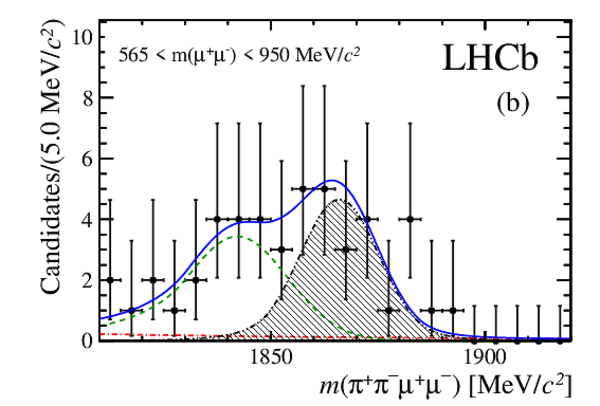
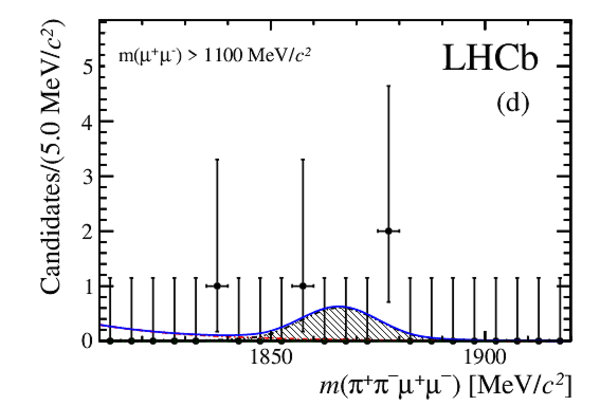
Distributions of $m(\pi^+\pi^-\mu^+\mu^-)$ for $ D ^0 \rightarrow \pi ^+ \pi ^- \mu ^+\mu ^- $ candidates in the (a) low- $ m(\mu ^+\mu ^- )$ , (b) $\rho$ / $\omega$ , (c) $\phi$ , and (d) high- $ m(\mu ^+\mu ^- )$ regions, with $\Delta m$ in the range $144.4-146.6$ $ {\mathrm{ Me V /}c^2}$ . The data are shown as points (black) and the fit result (dark blue line) is overlaid. The components of the fit are also shown: the signal (filled area), the $ D ^0 \rightarrow \pi ^+ \pi ^- \pi ^+ \pi ^- $ background (green dashed line) and the non-peaking background (red dashed-dotted line). |
Fig2a.pdf [18 KiB] HiDef png [188 KiB] Thumbnail [158 KiB] *.C file |
|
|
Fig2b.pdf [18 KiB] HiDef png [261 KiB] Thumbnail [228 KiB] *.C file |
|
|
|
Fig2c.pdf [18 KiB] HiDef png [254 KiB] Thumbnail [223 KiB] *.C file |

|
|
|
Fig2d.pdf [17 KiB] HiDef png [167 KiB] Thumbnail [144 KiB] *.C file |
|
|
|
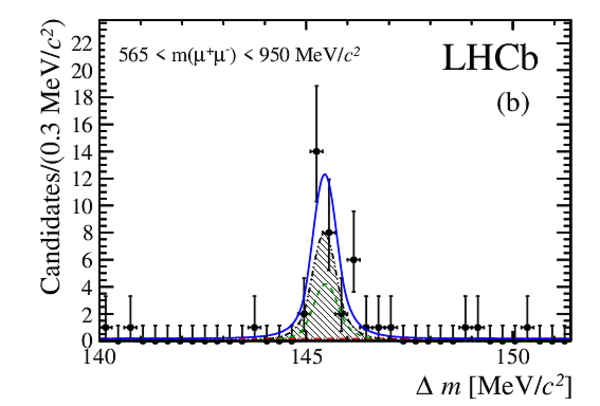
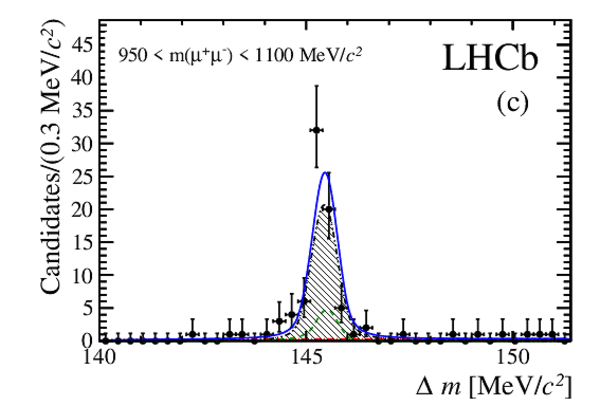
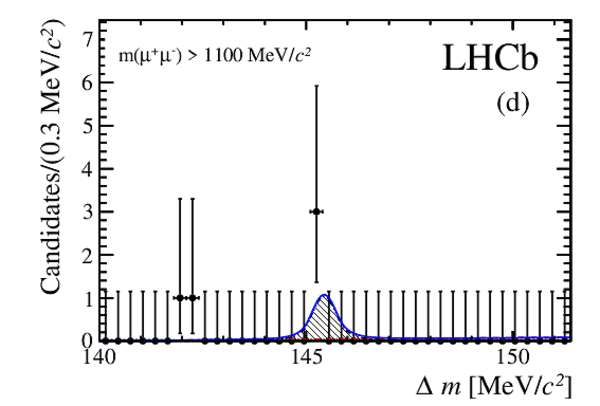
Distributions of $\Delta m$ for $ D ^0 \rightarrow \pi ^+ \pi ^- \mu ^+\mu ^- $ candidates in the (a) low- $ m(\mu ^+\mu ^- )$ , (b) $\rho$ / $\omega$ , (c) $\phi$ , and (d) high- $ m(\mu ^+\mu ^- )$ regions, with the $ D ^0$ invariant mass in the range $1840-1888$ $ {\mathrm{ Me V /}c^2}$ . The data are shown as points (black) and the fit result (dark blue line) is overlaid. The components of the fit are also shown: the signal (filled area), the $ D ^0 \rightarrow \pi ^+ \pi ^- \pi ^+ \pi ^- $ background (green dashed line) and the non-peaking background (red dashed-dotted line). |
Fig3a.pdf [19 KiB] HiDef png [189 KiB] Thumbnail [152 KiB] *.C file |

|
|
Fig3b.pdf [20 KiB] HiDef png [204 KiB] Thumbnail [181 KiB] *.C file |
|
|
|
Fig3c.pdf [21 KiB] HiDef png [204 KiB] Thumbnail [181 KiB] *.C file |
|
|
|
Fig3d.pdf [19 KiB] HiDef png [154 KiB] Thumbnail [138 KiB] *.C file |
|
|
|
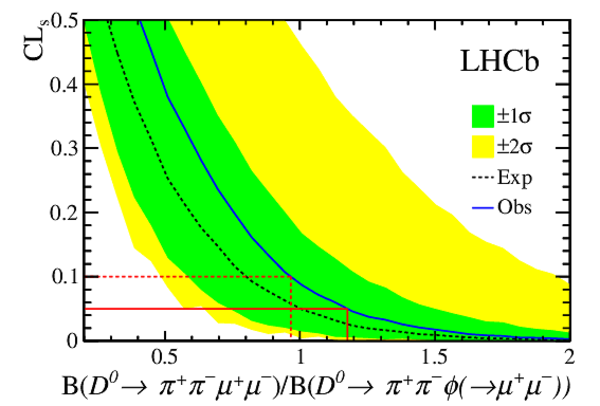
Observed (solid curve) and expected (dashed curve) $\mathrm{CL}_{s}$ values as a function of $\cal B ( D ^0 \rightarrow \pi ^+ \pi ^- \mu ^+\mu ^- )/\cal B ( D ^0 \rightarrow \pi ^+ \pi ^- \phi(\rightarrow \mu ^+\mu ^- ) )$. The green (yellow) shaded area contains 68.3% and 95.5% of the results of the analysis on experiments simulated with no signal. The upper limits at the 90(95)% $\mathrm{CL}$ are indicated by the dashed (solid) line. |
Fig4.pdf [14 KiB] HiDef png [180 KiB] Thumbnail [148 KiB] *.C file |
|
|
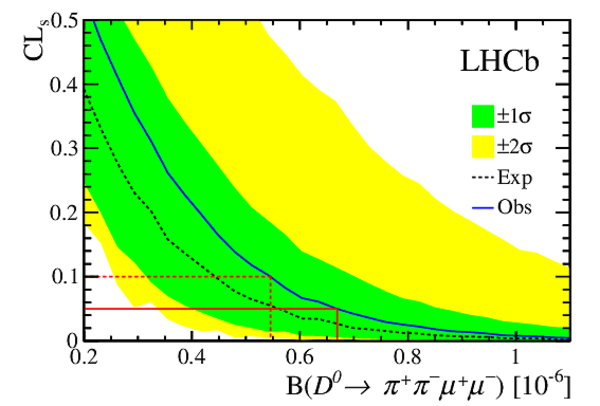
Observed (solid curve) and expected (dashed curve) $\mathrm{CL}_{s}$ values as a function of $\cal B$ ( $ D ^0 \rightarrow \pi ^+ \pi ^- \mu ^+\mu ^- $ ). The green (yellow) shaded area contains 68.3% and 95.5% of the results of the analysis on experiments simulated with no signal. The upper limits at the 90(95)% $\mathrm{CL}$ are indicated by the dashed (solid) line. |
Fig5.pdf [14 KiB] HiDef png [167 KiB] Thumbnail [136 KiB] *.C file |
|
|
Animated gif made out of all figures. |
PAPER-2013-050.gif Thumbnail |

|
![HiDef png [47 KiB]](Directory_LHCb-PAPER-2013-050/hidef_Fig_1.png)
![HiDef png [188 KiB]](Directory_LHCb-PAPER-2013-050/hidef_Fig2a.png)
![HiDef png [261 KiB]](Directory_LHCb-PAPER-2013-050/hidef_Fig2b.png)
![HiDef png [254 KiB]](Directory_LHCb-PAPER-2013-050/hidef_Fig2c.png)
![HiDef png [167 KiB]](Directory_LHCb-PAPER-2013-050/hidef_Fig2d.png)
![HiDef png [189 KiB]](Directory_LHCb-PAPER-2013-050/hidef_Fig3a.png)
![HiDef png [204 KiB]](Directory_LHCb-PAPER-2013-050/hidef_Fig3b.png)
![HiDef png [204 KiB]](Directory_LHCb-PAPER-2013-050/hidef_Fig3c.png)
![HiDef png [154 KiB]](Directory_LHCb-PAPER-2013-050/hidef_Fig3d.png)
![HiDef png [180 KiB]](Directory_LHCb-PAPER-2013-050/hidef_Fig4.png)
![HiDef png [167 KiB]](Directory_LHCb-PAPER-2013-050/hidef_Fig5.png)
Tables and captions
|
$D^0\rightarrow \pi^+\pi^-\mu^+\mu^-$ fitted yields in the four $m(\mu^+\mu^-)$ regions. The corresponding signal fractions under the assumption of a phase-space model, as described in Section 7, are listed in the last column. |
Table_1.pdf [47 KiB] HiDef png [33 KiB] Thumbnail [14 KiB] tex code |

|
|
Relative systematic uncertainties averaged over all the $ m(\mu ^+\mu ^- )$ regions for the efficiency ratio. |
Table_2.pdf [18 KiB] HiDef png [54 KiB] Thumbnail [25 KiB] tex code |

|
|
Upper limits on $\mathcal{\cal B }( D ^0 \rightarrow \pi ^+ \pi ^- \mu ^+\mu ^- )/\mathcal{\cal B }( D ^0 \rightarrow \pi ^+ \pi ^- \phi (\rightarrow \mu ^+ \mu^-))$ at 90 and 95% $\mathrm{CL}$ , and p-values for the background-only hypothesis in each $ m(\mu ^+\mu ^- )$ region and in the full $ m(\mu ^+\mu ^- )$ range (assuming a phase-space model). |
Table_3.pdf [37 KiB] HiDef png [57 KiB] Thumbnail [26 KiB] tex code |

|
|
Upper limits on $\mathcal{\cal B }( D ^0 \rightarrow \pi ^+ \pi ^- \mu ^+\mu ^- )$ at 90 and 95% $\mathrm{CL}$ in each $ m(\mu ^+\mu ^- )$ region and in the full $ m(\mu ^+\mu ^- )$ range (assuming a phase-space model). |
Table_4.pdf [43 KiB] HiDef png [39 KiB] Thumbnail [18 KiB] tex code |

|
![HiDef png [33 KiB]](Directory_LHCb-PAPER-2013-050/hidef_Table_1.png)
![HiDef png [54 KiB]](Directory_LHCb-PAPER-2013-050/hidef_Table_2.png)
![HiDef png [57 KiB]](Directory_LHCb-PAPER-2013-050/hidef_Table_3.png)
![HiDef png [39 KiB]](Directory_LHCb-PAPER-2013-050/hidef_Table_4.png)
Created on 27 April 2024.