Measurement of $D^{0}-\bar{D}^0$ mixing parameters and search for CP violation using $D^{0} \to K^{+}\pi^{-}$ decays
[to restricted-access page]Information
LHCb-PAPER-2013-053
CERN-PH-EP-2013-176
arXiv:1309.6534 [PDF]
(Submitted on 25 Sep 2013)
Phys. Rev. Lett. 111 (2013) 251801
Inspire 1255432
Tools
Abstract
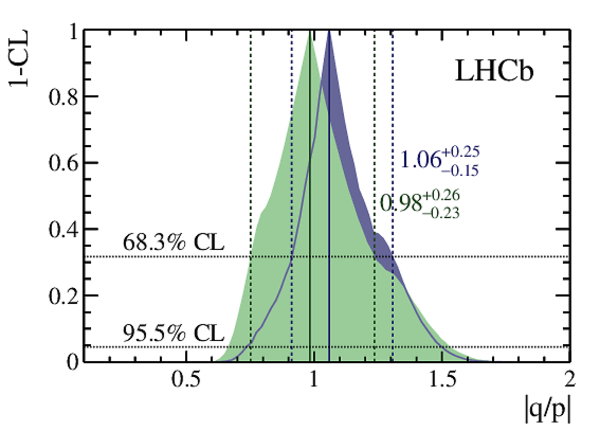
Measurements of charm mixing parameters from the decay-time-dependent ratio of D0->K+pi- to D0->K-pi+ rates and the charge-conjugate ratio are reported. The analysis uses data, corresponding to 3 fb^{-1} of integrated luminosity, from proton-proton collisions at 7 and 8 TeV center-of-mass energies recorded by the LHCb experiment. In the limit of charge-parity (CP) symmetry, the mixing parameters are determined to be x'^2=(5.5 +- 4.9)x10^{-5}, y'= (4.8 +- 1.0)x10^{-3}, and R_D=(3.568 +- 0.066)x10^{-3}. Allowing for CP violation, the mixing parameters are determined separately for D0 and D0bar mesons yielding A_D = (-0.7 +- 1.9), for the direct CP-violating asymmetry, and 0.75 < |q/p|< 1.24 at the 68.3 confidence level, where q and p are parameters that describe the mass eigenstates of the neutral charm mesons in terms of the flavor eigenstates. This is the most precise determination of these parameters from a single experiment and shows no evidence for CP violation.
Figures and captions
|
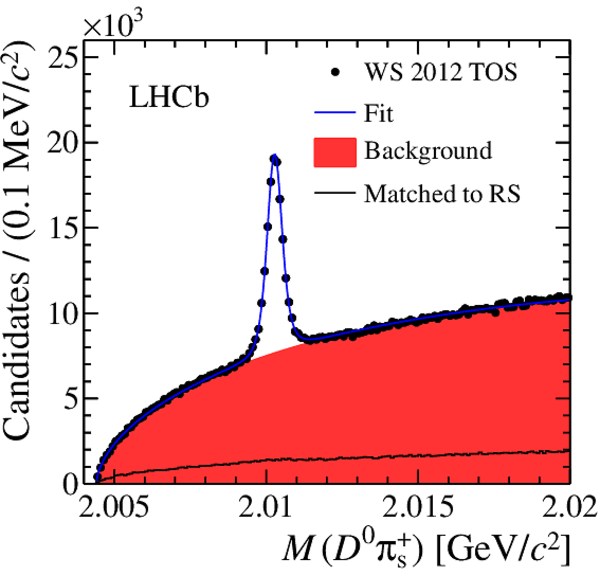
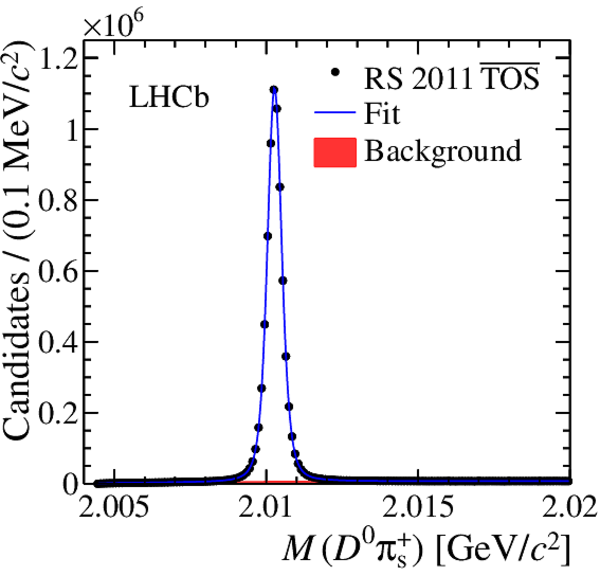
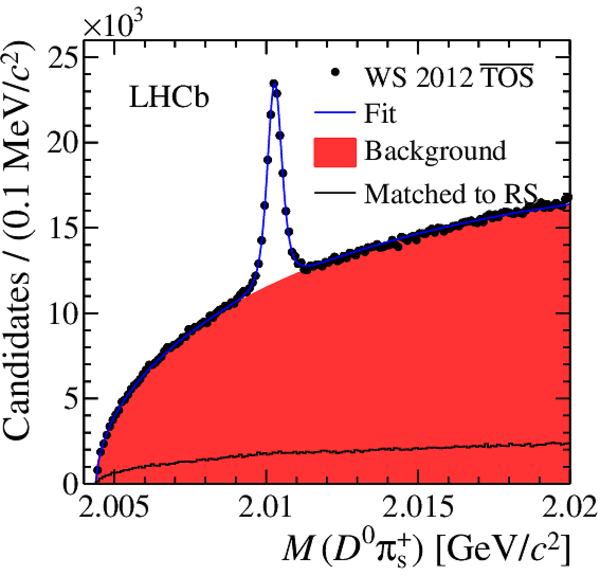
Distribution of $ M( D ^0 \pi_{\rm s} ^+)$ for selected (a) right-sign $ D ^0 \rightarrow K^-\pi^+$ and (b) wrong-sign $ D ^0 \rightarrow K^+\pi^-$ candidates. |
Fig1a.pdf [29 KiB] HiDef png [222 KiB] Thumbnail [196 KiB] *.C file |

|
|
Fig1b.pdf [29 KiB] HiDef png [252 KiB] Thumbnail [213 KiB] *.C file |

|
|
|
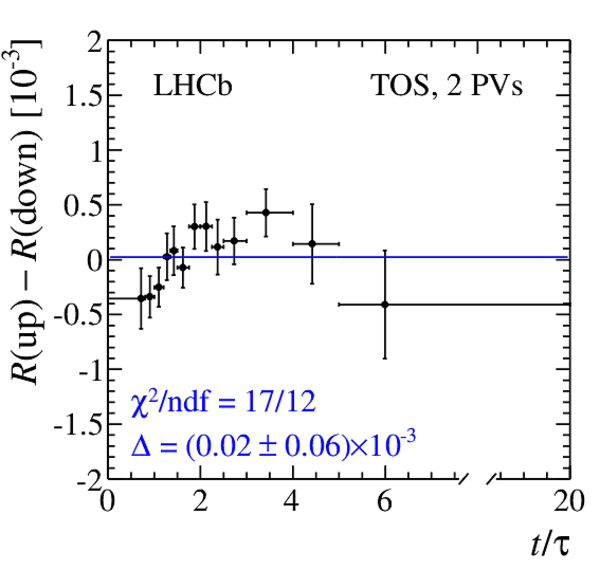
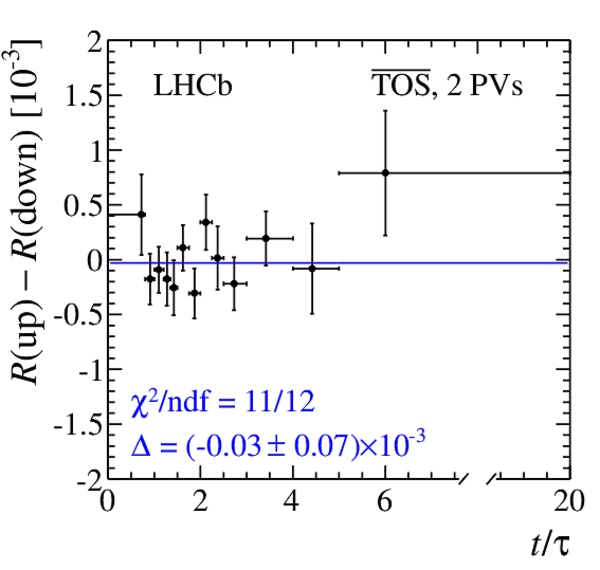
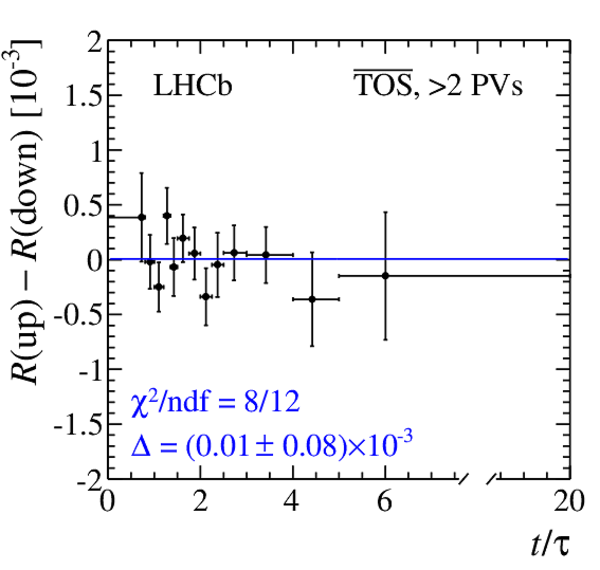
Efficiency-corrected ratios of WS-to-RS yields for (a) $ D ^{*+}$ decays, (b) $ D ^{*-}$ decays, and (c) their differences as functions of decay time in units of $ D ^0$ lifetime. Projections of fits allowing for (dashed line) no $ C P$ violation, (dotted line) no direct $ C P$ violation, and (solid line) full $ C P$ violation are overlaid. The abscissa of the data points corresponds to the average decay time over the bin; the error bars indicate the statistical uncertainties. |
Fig2.pdf [15 KiB] HiDef png [255 KiB] Thumbnail [237 KiB] *.C file |

|
|
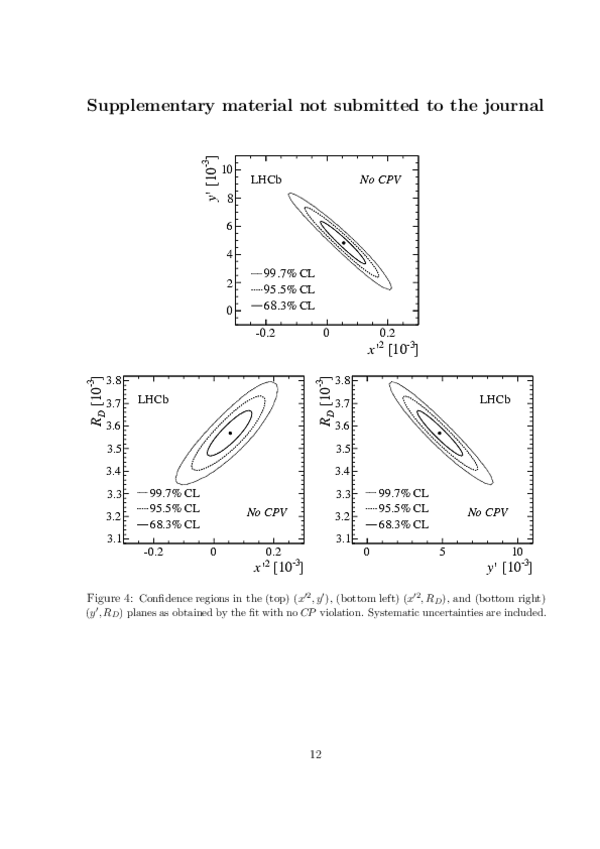
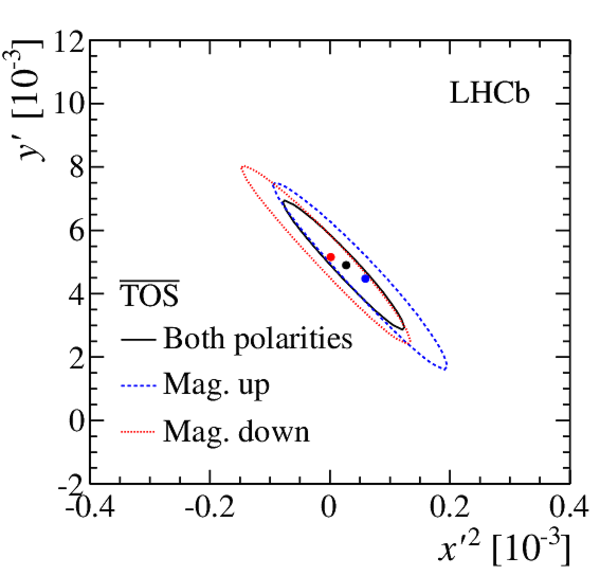
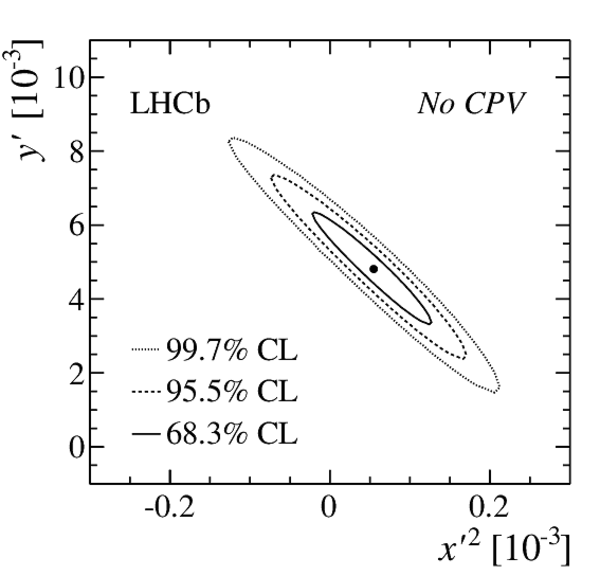
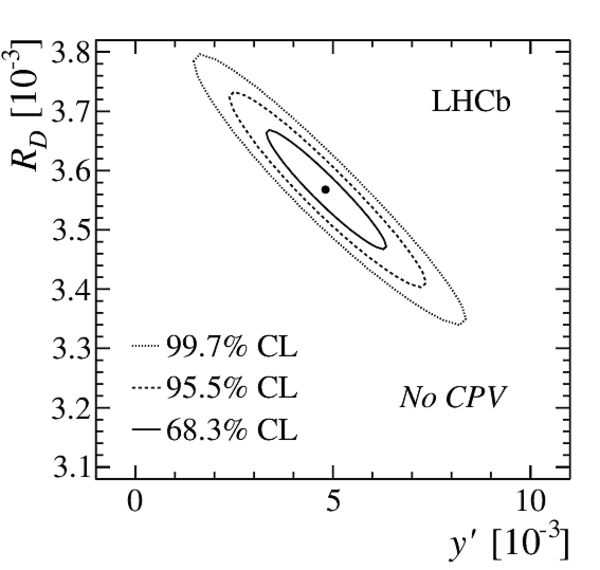
Two-dimensional confidence regions in the $(x'^2,y')$ plane obtained (a) without any restriction on $ C P$ violation, (b) assuming no direct $ C P$ violation, and (c) assuming $ C P$ conservation. The dashed (solid) curves in (a) and (b) indicate the contours of the mixing parameters associated with $\overline{ D }{} ^0$ ( $ D ^0$ ) decays. The best-fit value for $\overline{ D }{} ^0$ ( $ D ^0$ ) decays is shown with an open (filled) point. The solid, dashed, and dotted curves in (c) indicate the contours of $ C P$ -averaged mixing parameters at 68.3%, 95.5%, and 99.7% confidence level (CL), respectively. The best-fit value is shown with a point. |
Fig3.pdf [18 KiB] HiDef png [163 KiB] Thumbnail [146 KiB] *.C file |

|
|
Animated gif made out of all figures. |
PAPER-2013-053.gif Thumbnail |

|
Tables and captions
|
Results of fits to the data for different hypotheses on the $ C P$ symmetry. The reported uncertainties are statistical and systematic, respectively; ndf indicates the number of degrees of freedom. See App. A for fits results including correlation coefficients. |
Table_1.pdf [53 KiB] HiDef png [315 KiB] Thumbnail [148 KiB] tex code |

|
|
Detailed fit results. Reported uncertainties and correlation coefficients include both statistical and systematic sources. |
Table_2.pdf [54 KiB] HiDef png [47 KiB] Thumbnail [19 KiB] tex code |

|
Supplementary Material [file]


![HiDef png [222 KiB]](Directory_LHCb-PAPER-2013-053/hidef_Fig1a.png)
![HiDef png [252 KiB]](Directory_LHCb-PAPER-2013-053/hidef_Fig1b.png)
![HiDef png [255 KiB]](Directory_LHCb-PAPER-2013-053/hidef_Fig2.png)
![HiDef png [163 KiB]](Directory_LHCb-PAPER-2013-053/hidef_Fig3.png)
![HiDef png [315 KiB]](Directory_LHCb-PAPER-2013-053/hidef_Table_1.png)
![HiDef png [47 KiB]](Directory_LHCb-PAPER-2013-053/hidef_Table_2.png)
![HiDef png [312 KiB]](Directory_LHCb-PAPER-2013-053/supplementary/hidef_Fig10.png)
![HiDef png [196 KiB]](Directory_LHCb-PAPER-2013-053/supplementary/hidef_Fig11a.png)
![HiDef png [183 KiB]](Directory_LHCb-PAPER-2013-053/supplementary/hidef_Fig11b.png)
![HiDef png [226 KiB]](Directory_LHCb-PAPER-2013-053/supplementary/hidef_Fig12a.png)
![HiDef png [276 KiB]](Directory_LHCb-PAPER-2013-053/supplementary/hidef_Fig12b.png)
![HiDef png [219 KiB]](Directory_LHCb-PAPER-2013-053/supplementary/hidef_Fig12c.png)
![HiDef png [271 KiB]](Directory_LHCb-PAPER-2013-053/supplementary/hidef_Fig12d.png)
![HiDef png [226 KiB]](Directory_LHCb-PAPER-2013-053/supplementary/hidef_Fig13a.png)
![HiDef png [288 KiB]](Directory_LHCb-PAPER-2013-053/supplementary/hidef_Fig13b.png)
![HiDef png [222 KiB]](Directory_LHCb-PAPER-2013-053/supplementary/hidef_Fig13c.png)
![HiDef png [287 KiB]](Directory_LHCb-PAPER-2013-053/supplementary/hidef_Fig13d.png)
![HiDef png [173 KiB]](Directory_LHCb-PAPER-2013-053/supplementary/hidef_Fig14a.png)
![HiDef png [177 KiB]](Directory_LHCb-PAPER-2013-053/supplementary/hidef_Fig14b.png)
![HiDef png [126 KiB]](Directory_LHCb-PAPER-2013-053/supplementary/hidef_Fig4a.png)
![HiDef png [142 KiB]](Directory_LHCb-PAPER-2013-053/supplementary/hidef_Fig4b.png)
![HiDef png [138 KiB]](Directory_LHCb-PAPER-2013-053/supplementary/hidef_Fig4c.png)
![HiDef png [171 KiB]](Directory_LHCb-PAPER-2013-053/supplementary/hidef_Fig5.png)
![HiDef png [100 KiB]](Directory_LHCb-PAPER-2013-053/supplementary/hidef_Fig6.png)
![HiDef png [124 KiB]](Directory_LHCb-PAPER-2013-053/supplementary/hidef_Fig7a.png)
![HiDef png [126 KiB]](Directory_LHCb-PAPER-2013-053/supplementary/hidef_Fig7b.png)
![HiDef png [183 KiB]](Directory_LHCb-PAPER-2013-053/supplementary/hidef_Fig8a.png)
![HiDef png [181 KiB]](Directory_LHCb-PAPER-2013-053/supplementary/hidef_Fig8b.png)
![HiDef png [170 KiB]](Directory_LHCb-PAPER-2013-053/supplementary/hidef_Fig9a.png)
![HiDef png [172 KiB]](Directory_LHCb-PAPER-2013-053/supplementary/hidef_Fig9b.png)
![HiDef png [172 KiB]](Directory_LHCb-PAPER-2013-053/supplementary/hidef_Fig9c.png)
![HiDef png [171 KiB]](Directory_LHCb-PAPER-2013-053/supplementary/hidef_Fig9d.png)
![HiDef png [174 KiB]](Directory_LHCb-PAPER-2013-053/supplementary/hidef_Fig9e.png)
![HiDef png [174 KiB]](Directory_LHCb-PAPER-2013-053/supplementary/hidef_Fig9f.png)
Created on 27 April 2024.