Information
LHCb-PAPER-2013-057
CERN-PH-EP-2013-199
arXiv:1310.7953 [PDF]
(Submitted on 29 Oct 2013)
Phys. Lett. B728 (2014) 585
Inspire 1262699
Tools
Abstract
A search for CP violation in the phase space of the decay $D^+\to\pi^-\pi^+\pi^+$ is reported using $pp$ collision data, corresponding to an integrated luminosity of 1.0 fb$^{-1}$, collected by the LHCb experiment at a centre-of-mass energy of 7 TeV. The Dalitz plot distributions for $3.1\times 10^6$ $D^+$ and $D^-$ candidates are compared with binned and unbinned model-independent techniques. No evidence for CP violation is found.
Figures and captions
|
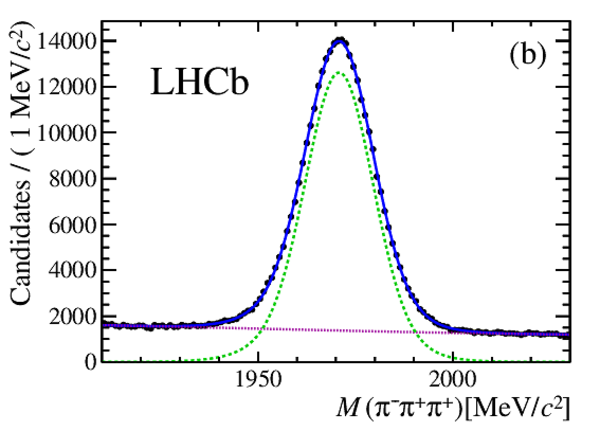
Invariant-mass distributions for (a) $ D ^+$ and (b) $ D ^+_ s $ candidates in the momentum range $50<p_{ D ^+ _{(s)}} <100$ $ {\mathrm{ Ge V /}c}$ for magnet up data. Data points are shown in black. The solid (blue) line is the fit function, the (green) dashed line is the signal component and the (magenta) dotted line is the background. |
Fig1a.pdf [27 KiB] HiDef png [251 KiB] Thumbnail [194 KiB] *.C file |

|
|
Fig1b.pdf [28 KiB] HiDef png [253 KiB] Thumbnail [193 KiB] *.C file |
|
|
|
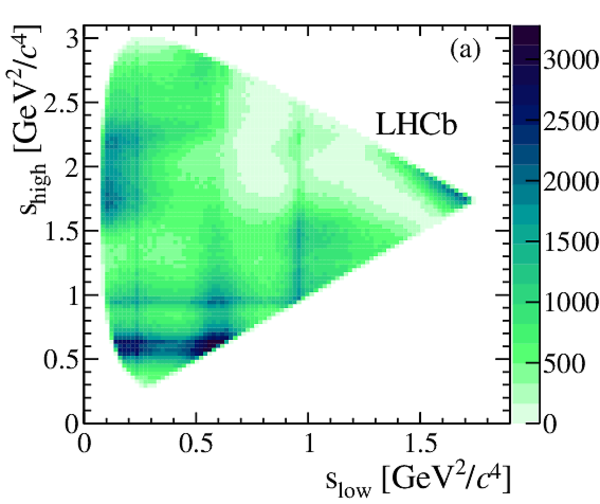
Dalitz plots for (a) $ D ^+ \rightarrow \pi ^- \pi ^+ \pi ^+ $ and (b) $ D ^+_ s \rightarrow \pi ^- \pi ^+ \pi ^+ $ candidates selected within $\pm2\tilde\sigma$ around the respective $\tilde m$ weighted average mass. |
Fig2a.pdf [33 KiB] HiDef png [592 KiB] Thumbnail [434 KiB] *.C file |
|
|
Fig2b.pdf [31 KiB] HiDef png [494 KiB] Thumbnail [385 KiB] *.C file |

|
|
|
(a) Distribution of $\mathcal{S}_{CP}^i$ with 49 $ D ^+_ s $ adaptive bins of equal population in the $ D ^+_ s \rightarrow \pi ^- \pi ^+ \pi ^+ $ Dalitz plot and (b) the corresponding one-dimensional distribution (histogram) with a standard normal Gaussian function superimposed (solid line). |
Fig3a.pdf [137 KiB] HiDef png [228 KiB] Thumbnail [169 KiB] *.C file |

|
|
Fig3b.pdf [14 KiB] HiDef png [79 KiB] Thumbnail [49 KiB] *.C file |

|
|
|
Dalitz plot for $ D ^+_ s \rightarrow \pi ^- \pi ^+ \pi ^+ $ control sample decays divided into (a) seven regions R1-R7 and (b) three regions P1-P3. Region R3 is further divided into two regions of $s_{\rm high}$ at masses smaller (R3l) and larger (R3r) than the $\rho^{0}(770)$ resonance. |
Fig4a.pdf [81 KiB] HiDef png [561 KiB] Thumbnail [301 KiB] *.C file |

|
|
Fig4b.pdf [80 KiB] HiDef png [543 KiB] Thumbnail [293 KiB] *.C file |

|
|
|
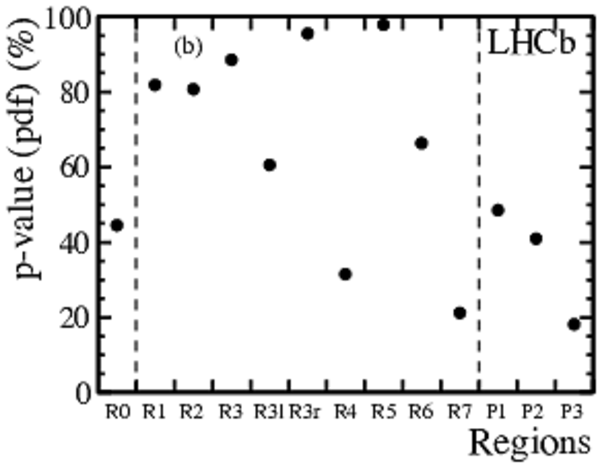
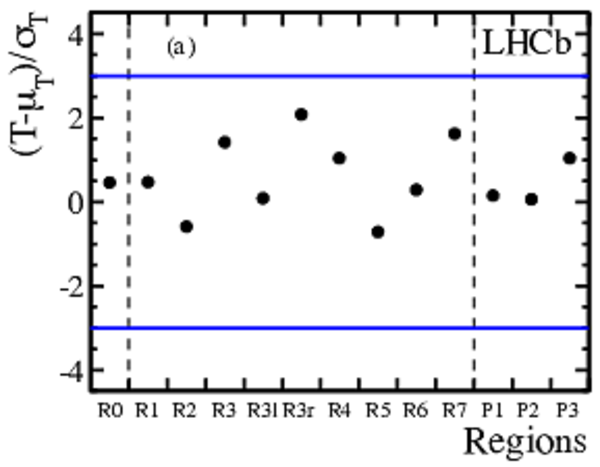
(a) Pull values of $T$ and (b) the corresponding p-values for $ D ^+_ s \rightarrow \pi ^- \pi ^+ \pi ^+ $ control sample candidates restricted to each region, obtained using the kNN method with $n_k=20$. The horizontal blue lines in (a) represent $-3$ and $+3$ pull values. The region R0 corresponds to the full Dalitz plot. Note that the points for the overlapping regions are correlated. |
Fig5a.pdf [58 KiB] HiDef png [115 KiB] Thumbnail [190 KiB] *.C file |

|
|
Fig5b.pdf [58 KiB] HiDef png [109 KiB] Thumbnail [92 KiB] *.C file |
|
|
|
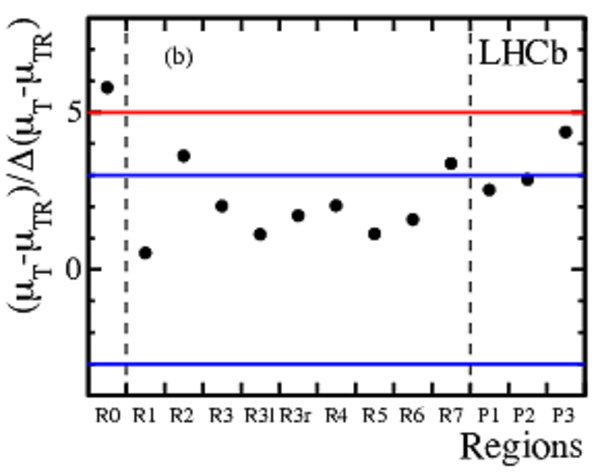
(a) Raw asymmetry $A=(N_--N_+)/(N_-+N_+)$ and (b) the pull values of $\mu_T$ for $ D ^+_ s \rightarrow \pi ^- \pi ^+ \pi ^+ $ control sample candidates restricted to each region. The horizontal lines in (b) represent $+3$ and $+5$ pull values. The region R0 corresponds to the full Dalitz plot. Note that the points for the overlapping regions are correlated. |
Fig6a.pdf [47 KiB] HiDef png [107 KiB] Thumbnail [73 KiB] *.C file |

|
|
Fig6b.pdf [58 KiB] HiDef png [122 KiB] Thumbnail [191 KiB] *.C file |
|
|
|
(a) Pull values of $T$ and (b) the corresponding p-values for the background candidates restricted to each region obtained using the kNN method with $n_k=20$. The horizontal blue lines in (a) represent $-3$ and $+3$ pull values. The region R0 corresponds to the full Dalitz plot. Note that the points for the overlapping regions are correlated. |
Fig7a.pdf [57 KiB] HiDef png [113 KiB] Thumbnail [193 KiB] *.C file |
|
|
Fig7b.pdf [57 KiB] HiDef png [110 KiB] Thumbnail [92 KiB] *.C file |

|
|
|
(a) Raw asymmetry and (b) pull value of $\mu_T$ as a function of a region for the background candidates. The horizontal lines in (b) represent $+3$ and $+5$ pull values. The region R0 corresponds to the full Dalitz plot. Note that the points for the overlapping regions are correlated. |
Fig8a.pdf [28 KiB] HiDef png [108 KiB] Thumbnail [94 KiB] *.C file |

|
|
Fig8b.pdf [57 KiB] HiDef png [118 KiB] Thumbnail [193 KiB] *.C file |

|
|
|
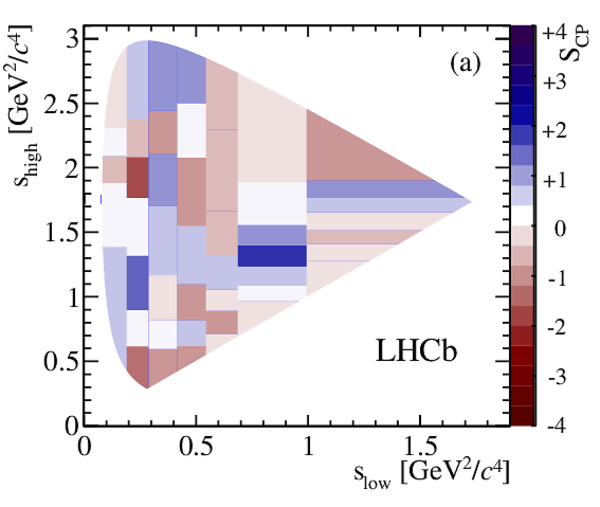
Distributions of $\mathcal{S}_{CP}^i$ across the $ D ^+$ Dalitz plane, with the adaptive binning scheme of uniform population for the total $ D ^+ \rightarrow \pi ^- \pi ^+ \pi ^+ $ data sample with (a) 49 and (c) 100 bins. The corresponding one-dimensional $\mathcal{S}_{CP}^i$ distributions (b) and (d) are shown with a standard normal Gaussian function superimposed (solid line). |
Fig9a.pdf [247 KiB] HiDef png [173 KiB] Thumbnail [152 KiB] *.C file |
|
|
Fig9b.pdf [14 KiB] HiDef png [77 KiB] Thumbnail [48 KiB] *.C file |

|
|
|
Fig9c.pdf [250 KiB] HiDef png [187 KiB] Thumbnail [165 KiB] *.C file |

|
|
|
Fig9d.pdf [14 KiB] HiDef png [80 KiB] Thumbnail [47 KiB] *.C file |

|
|
|
(a) Distribution of $\mathcal{S}_{CP}^i$ with 98 bins in the uniform binning scheme for the total $ D ^+ \rightarrow \pi ^- \pi ^+ \pi ^+ $ data sample and (b) the corresponding one-dimensional $\mathcal{S}_{CP}^i$ distribution (b) with a standard normal Gaussian function superimposed (solid line). |
Fig10a.pdf [225 KiB] HiDef png [165 KiB] Thumbnail [146 KiB] *.C file |

|
|
Fig10b.pdf [14 KiB] HiDef png [77 KiB] Thumbnail [45 KiB] *.C file |

|
|
|
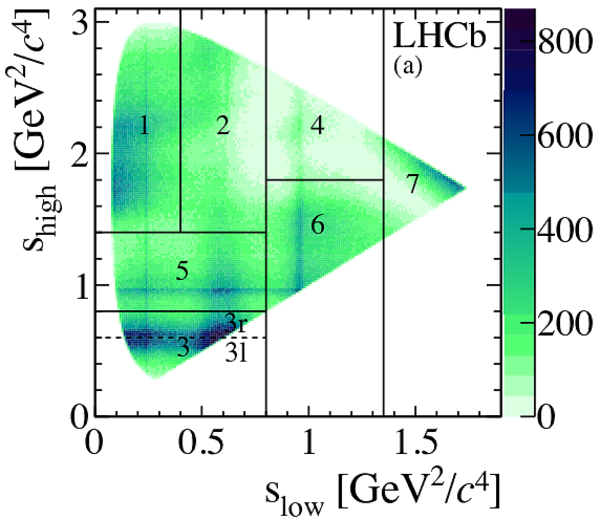
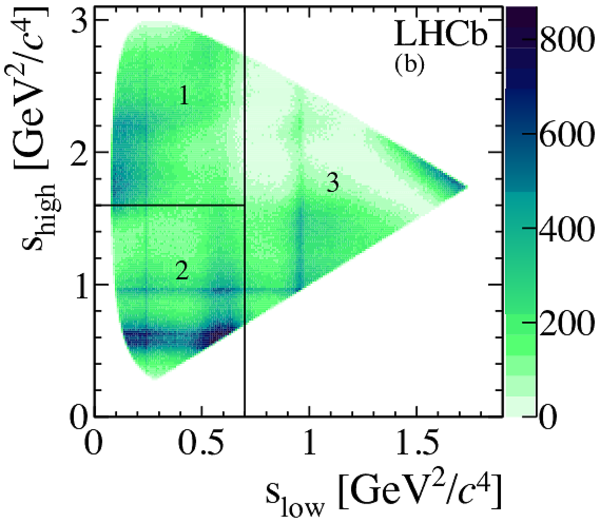
Dalitz plot for $ D ^+ \rightarrow \pi ^- \pi ^+ \pi ^+ $ candidates divided into (a) seven regions R1-R7 and (b) three regions P1-P3. |
Fig11a.pdf [146 KiB] HiDef png [1 MiB] Thumbnail [476 KiB] *.C file |
|
|
Fig11b.pdf [145 KiB] HiDef png [1 MiB] Thumbnail [474 KiB] *.C file |
|
|
|
(a) Raw asymmetry and (b) the pull values of $\mu_T$ for $ D ^+ \rightarrow \pi ^- \pi ^+ \pi ^+ $ candidates restricted to each region. The horizontal lines in (b) represent pull values $+3$ and $+5$. The region R0 corresponds to the full Dalitz plot. Note that the points for the overlapping regions are correlated. |
Fig12a.pdf [47 KiB] HiDef png [110 KiB] Thumbnail [91 KiB] *.C file |

|
|
Fig12b.pdf [57 KiB] HiDef png [120 KiB] Thumbnail [194 KiB] *.C file |

|
|
|
(a) Pull values of $T$ and (b) the corresponding p-values for $ D ^+ \rightarrow \pi ^- \pi ^+ \pi ^+ $ candidates restricted to each region obtained using the kNN method with $n_k=20$. The horizontal blue lines in (a) represent pull values $-3$ and $+3$. The region R0 corresponds to the full Dalitz plot. Note that the points for the overlapping regions are correlated. |
Fig13a.pdf [57 KiB] HiDef png [112 KiB] Thumbnail [193 KiB] *.C file |

|
|
Fig13b.pdf [57 KiB] HiDef png [107 KiB] Thumbnail [91 KiB] *.C file |

|
|
|
Animated gif made out of all figures. |
PAPER-2013-057.gif Thumbnail |

|
![HiDef png [251 KiB]](Directory_LHCb-PAPER-2013-057/hidef_Fig1a.png)
![HiDef png [253 KiB]](Directory_LHCb-PAPER-2013-057/hidef_Fig1b.png)
![HiDef png [592 KiB]](Directory_LHCb-PAPER-2013-057/hidef_Fig2a.png)
![HiDef png [494 KiB]](Directory_LHCb-PAPER-2013-057/hidef_Fig2b.png)
![HiDef png [228 KiB]](Directory_LHCb-PAPER-2013-057/hidef_Fig3a.png)
![HiDef png [79 KiB]](Directory_LHCb-PAPER-2013-057/hidef_Fig3b.png)
![HiDef png [561 KiB]](Directory_LHCb-PAPER-2013-057/hidef_Fig4a.png)
![HiDef png [543 KiB]](Directory_LHCb-PAPER-2013-057/hidef_Fig4b.png)
![HiDef png [115 KiB]](Directory_LHCb-PAPER-2013-057/hidef_Fig5a.png)
![HiDef png [109 KiB]](Directory_LHCb-PAPER-2013-057/hidef_Fig5b.png)
![HiDef png [107 KiB]](Directory_LHCb-PAPER-2013-057/hidef_Fig6a.png)
![HiDef png [122 KiB]](Directory_LHCb-PAPER-2013-057/hidef_Fig6b.png)
![HiDef png [113 KiB]](Directory_LHCb-PAPER-2013-057/hidef_Fig7a.png)
![HiDef png [110 KiB]](Directory_LHCb-PAPER-2013-057/hidef_Fig7b.png)
![HiDef png [108 KiB]](Directory_LHCb-PAPER-2013-057/hidef_Fig8a.png)
![HiDef png [118 KiB]](Directory_LHCb-PAPER-2013-057/hidef_Fig8b.png)
![HiDef png [173 KiB]](Directory_LHCb-PAPER-2013-057/hidef_Fig9a.png)
![HiDef png [77 KiB]](Directory_LHCb-PAPER-2013-057/hidef_Fig9b.png)
![HiDef png [187 KiB]](Directory_LHCb-PAPER-2013-057/hidef_Fig9c.png)
![HiDef png [80 KiB]](Directory_LHCb-PAPER-2013-057/hidef_Fig9d.png)
![HiDef png [165 KiB]](Directory_LHCb-PAPER-2013-057/hidef_Fig10a.png)
![HiDef png [77 KiB]](Directory_LHCb-PAPER-2013-057/hidef_Fig10b.png)
![HiDef png [1 MiB]](Directory_LHCb-PAPER-2013-057/hidef_Fig11a.png)
![HiDef png [1 MiB]](Directory_LHCb-PAPER-2013-057/hidef_Fig11b.png)
![HiDef png [110 KiB]](Directory_LHCb-PAPER-2013-057/hidef_Fig12a.png)
![HiDef png [120 KiB]](Directory_LHCb-PAPER-2013-057/hidef_Fig12b.png)
![HiDef png [112 KiB]](Directory_LHCb-PAPER-2013-057/hidef_Fig13a.png)
![HiDef png [107 KiB]](Directory_LHCb-PAPER-2013-057/hidef_Fig13b.png)
Tables and captions
|
Results for the $D^+ \rightarrow \pi^-\pi^+\pi^+$ decay sample using the adaptive binning scheme with different numbers of bins. The number of degrees of freedom is the number of bins minus 1. |
Table_1.pdf [29 KiB] HiDef png [63 KiB] Thumbnail [27 KiB] tex code |

|
![HiDef png [63 KiB]](Directory_LHCb-PAPER-2013-057/hidef_Table_1.png)
Created on 27 April 2024.