Study of forward Z+jet production in pp collisions at $\sqrt{s}$ = 7 TeV
[to restricted-access page]Information
LHCb-PAPER-2013-058
CERN-PH-EP-2013-198
arXiv:1310.8197 [PDF]
(Submitted on 30 Oct 2013)
JHEP 01 (2014) 33
Inspire 1262703
Tools
Abstract
A measurement of the $Z(\rightarrow\mu^+\mu^-)$+jet production cross-section in $pp$ collisions at a centre-of-mass energy $\sqrt{s} = 7$ TeV is presented. The analysis is based on an integrated luminosity of $1.0 \text{fb}^{-1}$ recorded by the LHCb experiment. Results are shown with two jet transverse momentum thresholds, 10 and 20 GeV, for both the overall cross-section within the fiducial volume, and for six differential cross-section measurements. The fiducial volume requires that both the jet and the muons from the Z boson decay are produced in the forward direction ($2.0<\eta<4.5$). The results show good agreement with theoretical predictions at the second-order expansion in the coupling of the strong interaction.
Figures and captions
|
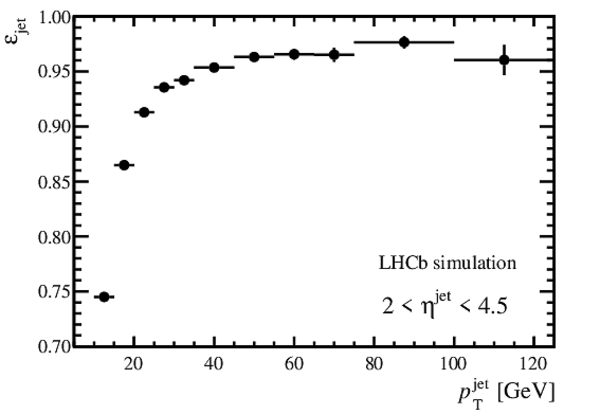
Jet identification efficiency as a function of the true jet $p_\text{T}$. The uncertainties shown are statistical. The zero on the vertical axis is suppressed. |
Fig1.pdf [14 KiB] HiDef png [78 KiB] Thumbnail [44 KiB] *.C file |
|
|
Comparison between data (black points) and simulation (red line) in the $p_\text{T}^\text{jet} / p_\text{T}^{ Z }$ distribution for selected $ Z $+1-jet events where the $ Z $ boson and the jet are emitted azimuthally opposed. The uncertainties shown are statistical. |
Fig2.pdf [17 KiB] HiDef png [158 KiB] Thumbnail [161 KiB] *.C file |

|
|
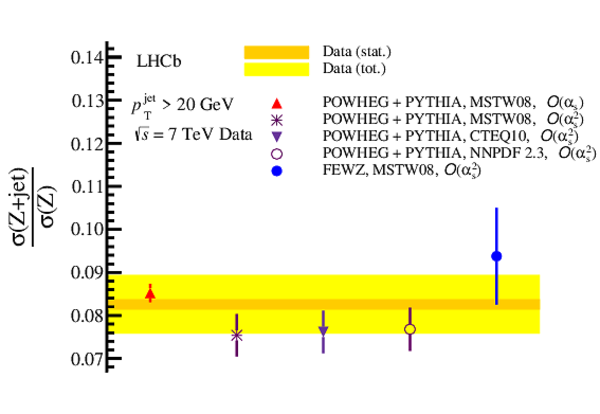
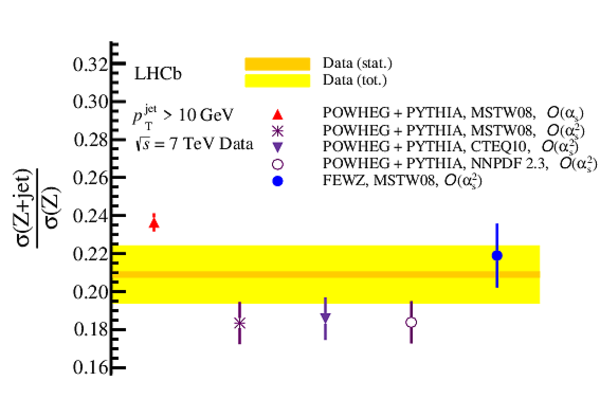
Ratio of the Z+jet cross-section to the inclusive cross-section, for (top) $p_\text{T}^\text{jet}> 20\text{ GeV}$ and (bottom) $p_\text{T}^\text{jet} > 10\text{ GeV}$. The bands show the LHCb measurement (with the inner band showing the statistical uncertainty and the outer band showing the total uncertainty). The points correspond to different theoretical predictions with the error bars indicating their uncertainties as described in the main text. These results are corrected for FSR from the final state muons from the $ Z $ boson decay. |
Fig3top.pdf [14 KiB] HiDef png [179 KiB] Thumbnail [155 KiB] *.C file |
|
|
Fig3bottom.pdf [14 KiB] HiDef png [184 KiB] Thumbnail [159 KiB] *.C file |
|
|
|
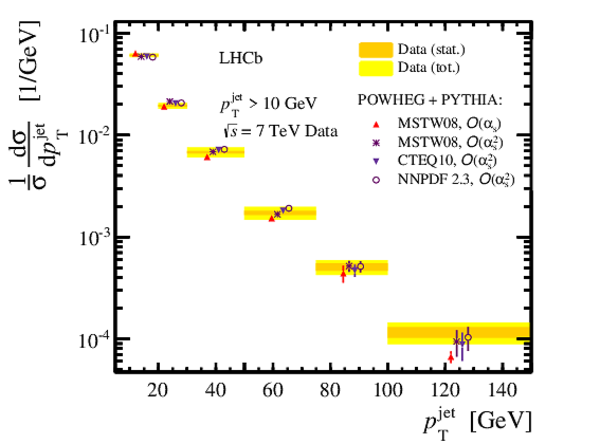
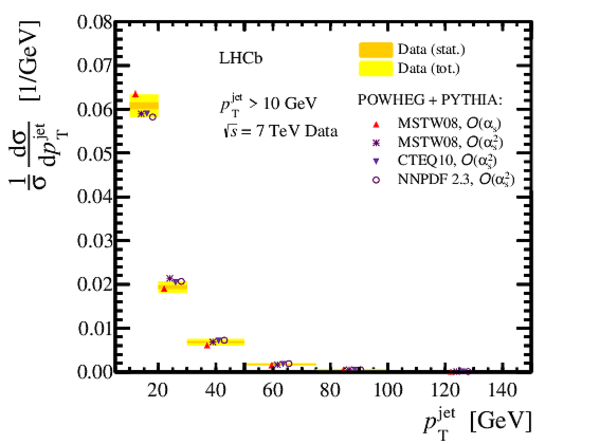
Cross-section for Z+jet production, differential in the leading jet $p_\text{T}$, for $p_\text{T}^\text{jet} > 10\text{ GeV}$. The bands show the LHCb measurement (with the inner band showing the statistical uncertainty and the outer band showing the total uncertainty). The points correspond to different theoretical predictions with the error bars indicating their uncertainties as described in the main text. Predictions are displaced horizontally for presentation. These results are not corrected for FSR from the final state muons from the $ Z $ boson decay. |
Fig4.pdf [16 KiB] HiDef png [181 KiB] Thumbnail [155 KiB] *.C file |
|
|
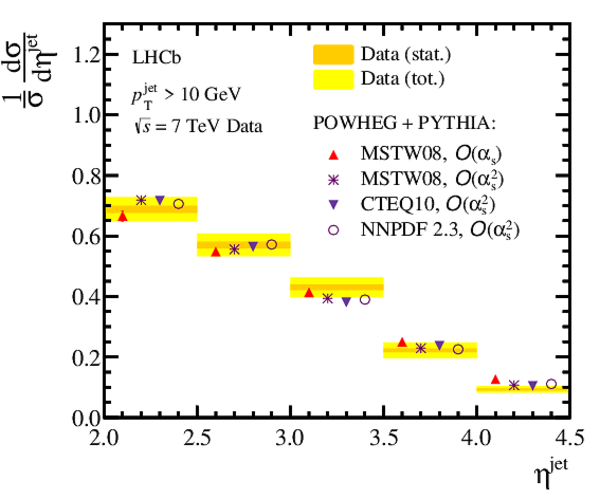
Cross-section for Z+jet production, differential in the leading jet pseudorapidity, for (left) $p_\text{T}^\text{jet}> 20\text{ GeV}$ and (right) $p_\text{T}^\text{jet} > 10\text{ GeV}$. The bands show the LHCb measurement (with the inner band showing the statistical uncertainty and the outer band showing the total uncertainty). Superimposed are predictions as described in Fig. 4. |
Fig5l.pdf [15 KiB] HiDef png [199 KiB] Thumbnail [174 KiB] *.C file |

|
|
Fig5r.pdf [15 KiB] HiDef png [202 KiB] Thumbnail [176 KiB] *.C file |
|
|
|
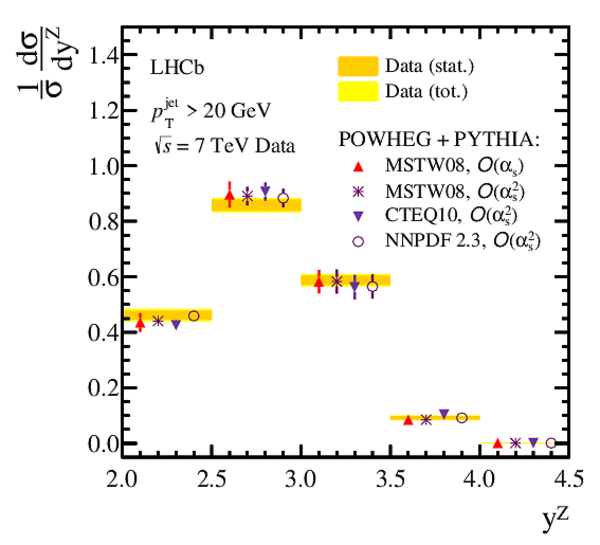
Cross-section for Z+jet production, differential in the $ Z $ boson rapidity, $y^ Z $, for (left) $p_\text{T}^\text{jet}> 20\text{ GeV}$ and (right) $p_\text{T}^\text{jet} > 10\text{ GeV}$. The bands show the LHCb measurement (with the inner band showing the statistical uncertainty and the outer band showing the total uncertainty). Superimposed are predictions as described in Fig. 4. |
Fig6l.pdf [15 KiB] HiDef png [217 KiB] Thumbnail [187 KiB] *.C file |
|
|
Fig6r.pdf [15 KiB] HiDef png [206 KiB] Thumbnail [179 KiB] *.C file |

|
|
|
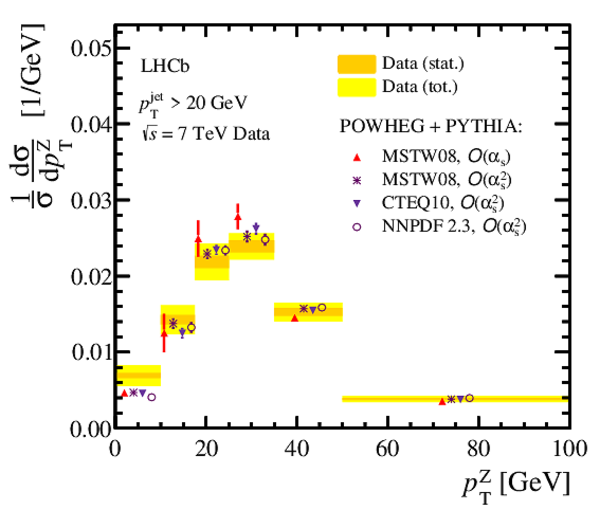
Cross-section for Z+jet production, differential in the $ Z $ boson transverse momentum, for (left) $p_\text{T}^\text{jet}> 20\text{ GeV}$ and (right) $p_\text{T}^\text{jet} > 10\text{ GeV}$. The bands show the LHCb measurement (with the inner band showing the statistical uncertainty and the outer band showing the total uncertainty). Superimposed are predictions as described in Fig. 4. |
Fig7l.pdf [15 KiB] HiDef png [196 KiB] Thumbnail [167 KiB] *.C file |

|
|
Fig7r.pdf [15 KiB] HiDef png [191 KiB] Thumbnail [163 KiB] *.C file |

|
|
|
Cross-section for Z+jet production, differential in the difference in $\phi$ between the $ Z $ boson and the leading jet, for (left) $p_\text{T}^\text{jet}> 20\text{ GeV}$ and (right) $p_\text{T}^\text{jet} > 10\text{ GeV}$. The bands show the LHCb measurement (with the inner band showing the statistical uncertainty and the outer band showing the total uncertainty). Superimposed are predictions as described in Fig. 4. |
Fig8l.pdf [15 KiB] HiDef png [195 KiB] Thumbnail [167 KiB] *.C file |

|
|
Fig8r.pdf [15 KiB] HiDef png [191 KiB] Thumbnail [164 KiB] *.C file |

|
|
|
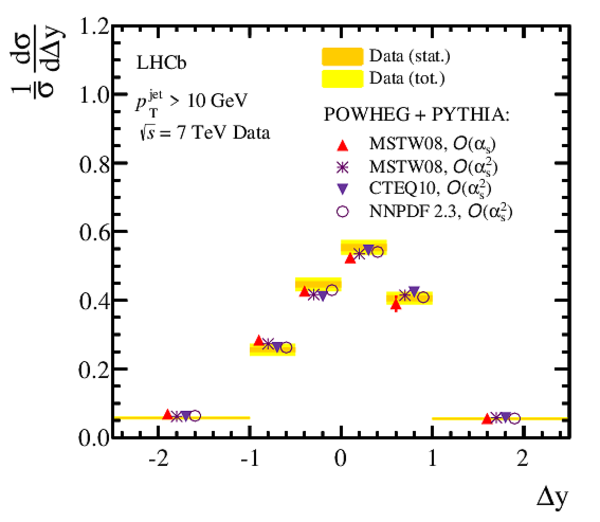
Cross-section for Z+jet production, differential in the difference in rapidity between the $ Z $ boson and the leading jet, for (left) $p_\text{T}^\text{jet}> 20\text{ GeV}$ and (right) $p_\text{T}^\text{jet} > 10\text{ GeV}$. The bands show the LHCb measurement (with the inner band showing the statistical uncertainty and the outer band showing the total uncertainty). Superimposed are predictions as described in Fig. 4. |
Fig9l.pdf [15 KiB] HiDef png [197 KiB] Thumbnail [161 KiB] *.C file |

|
|
Fig9r.pdf [15 KiB] HiDef png [200 KiB] Thumbnail [166 KiB] *.C file |
|
|
|
Animated gif made out of all figures. |
PAPER-2013-058.gif Thumbnail |

|
Tables and captions
|
The relative uncertainty arising from each source of possible systematic uncertainties considered for the Z+jet cross-section for $p_\text{T}^\text{jet}>20\text{ GeV}$. The relative uncertainties are similar for the 10 GeV threshold. The contributions from the different sources are combined in quadrature. |
Table_1.pdf [18 KiB] HiDef png [44 KiB] Thumbnail [19 KiB] tex code |

|
Supplementary Material [file]


![HiDef png [78 KiB]](Directory_LHCb-PAPER-2013-058/hidef_Fig1.png)
![HiDef png [158 KiB]](Directory_LHCb-PAPER-2013-058/hidef_Fig2.png)
![HiDef png [179 KiB]](Directory_LHCb-PAPER-2013-058/hidef_Fig3top.png)
![HiDef png [184 KiB]](Directory_LHCb-PAPER-2013-058/hidef_Fig3bottom.png)
![HiDef png [181 KiB]](Directory_LHCb-PAPER-2013-058/hidef_Fig4.png)
![HiDef png [199 KiB]](Directory_LHCb-PAPER-2013-058/hidef_Fig5l.png)
![HiDef png [202 KiB]](Directory_LHCb-PAPER-2013-058/hidef_Fig5r.png)
![HiDef png [217 KiB]](Directory_LHCb-PAPER-2013-058/hidef_Fig6l.png)
![HiDef png [206 KiB]](Directory_LHCb-PAPER-2013-058/hidef_Fig6r.png)
![HiDef png [196 KiB]](Directory_LHCb-PAPER-2013-058/hidef_Fig7l.png)
![HiDef png [191 KiB]](Directory_LHCb-PAPER-2013-058/hidef_Fig7r.png)
![HiDef png [195 KiB]](Directory_LHCb-PAPER-2013-058/hidef_Fig8l.png)
![HiDef png [191 KiB]](Directory_LHCb-PAPER-2013-058/hidef_Fig8r.png)
![HiDef png [197 KiB]](Directory_LHCb-PAPER-2013-058/hidef_Fig9l.png)
![HiDef png [200 KiB]](Directory_LHCb-PAPER-2013-058/hidef_Fig9r.png)
![HiDef png [44 KiB]](Directory_LHCb-PAPER-2013-058/hidef_Table_1.png)
![HiDef png [194 KiB]](Directory_LHCb-PAPER-2013-058/supplementary/hidef_Fig10.png)
![HiDef png [216 KiB]](Directory_LHCb-PAPER-2013-058/supplementary/hidef_Fig11l.png)
![HiDef png [218 KiB]](Directory_LHCb-PAPER-2013-058/supplementary/hidef_Fig11r.png)
![HiDef png [130 KiB]](Directory_LHCb-PAPER-2013-058/supplementary/hidef_Fig12.png)
![HiDef png [118 KiB]](Directory_LHCb-PAPER-2013-058/supplementary/hidef_Fig13.png)
![HiDef png [149 KiB]](Directory_LHCb-PAPER-2013-058/supplementary/hidef_Fig14.png)
![HiDef png [129 KiB]](Directory_LHCb-PAPER-2013-058/supplementary/hidef_Fig15.png)
![HiDef png [138 KiB]](Directory_LHCb-PAPER-2013-058/supplementary/hidef_Fig16.png)
![HiDef png [175 KiB]](Directory_LHCb-PAPER-2013-058/supplementary/hidef_Fig17b.png)
![HiDef png [246 KiB]](Directory_LHCb-PAPER-2013-058/supplementary/hidef_Fig17t.png)
![HiDef png [209 KiB]](Directory_LHCb-PAPER-2013-058/supplementary/hidef_Fig18.png)
![HiDef png [101 KiB]](Directory_LHCb-PAPER-2013-058/supplementary/hidef_Fig19.png)
![HiDef png [109 KiB]](Directory_LHCb-PAPER-2013-058/supplementary/hidef_Fig20.png)
![HiDef png [189 KiB]](Directory_LHCb-PAPER-2013-058/supplementary/hidef_Supp.png)
Created on 27 April 2024.